
Student JC: Post-transcriptional repression of circadian component CLOCK regulates cancer-stemness in murine breast cancer cells
Welcome to our Journal Club! I use this as a forum for open discussion about the paper in question. Anyone can participate in the journal club, and provide comments/critiques on the paper by leaving a comment below. This is the 2nd post written totally by a guest author, lab member Emma Davidson! Her post discusses an interesting finding from a recent paper from Takashi Ogino and colleagues on molecular components of the circadian clock and breast cancer. Emma really took a deep dive into this paper and the surrounding literature, so this one is packed with lots of information. Check out the paper here!

Credit: Dana-Farber Cancer Institute
One of the great challenges of treating cancer is its resilience- aggressive cancers are hard to target and treat, and often recur despite our best treatments. The work of Ogino et al. further explores one of the hypotheses of why certain cancers are so resistant to treatments, and suggests a potential new target to create more effective cancer treatments against these aggressive and persistent variants. According to Tudoran et al., approximately 30% of early stage breast cancer cases relapse (2016). One of the reasons this might be is because of the heterogeneity of cancers, basically referring to the slight differences that occur in the genetic makeup between one cancer cell to the next. While this may seem trivial, these differences are often the result of various mutations that allow the cancers to evade different treatments, grow faster, or metastasize more. Therefore, the more heterogenous the cancer, the harder it is to treat because of the greater number of mutations it has accumulated.
There are 2 types of heterogeneity that are problematic in cancer treatment: tumor heterogeneity and intra-patient heterogeneity. Tumor heterogeneity refers to how different cells within the same tumor can acquire new mutations and carry slightly different genetic information than each other within the same tumor. Intra-patient heterogeneity is the differences in genetics that can occur in one tumor in the body compared to a different metastasis elsewhere in the body. Prior discussions of tumor and intra-patient heterogeneity of cancers have suggested 2 primary models to explain these observations: the non-hierarchal model, which suggests this arises because of clonal evolution, and the hierarchal model, which introduces the idea of “cancer stem-like cells”, or CSCs, in which some cancer cells have a multipotency that allows for them to act similarly to stem cells to continually drive tumor growth and allow for various types of cells to evolve (See Fig. 1)(Tudoran et al., 2016).

Figure 1: Schematic of non-hierarchal (A) vs hierarchal model (B) explanations of cancer heterogeneity. Note in the hierarchal model, “cancer stem cells” divide in a way that produces both new variants and self- renews the stem cell type. The non-hierarchal model accumulates mutations after divisions that lead to heterogeneity. (Tudoran et al., 2016)
With more investigation, Ogino et al. and colleagues have identified primitive stem cell-like cancer cells in breast cancers, which has led them to believe this may be the cause of heterogeneity in these kinds of breast cancer (2021). These breast cancer stem-like cells (BCSCs) exhibit various characteristics that help them resist “normal” treatments, such as remaining quiescent and in G0 phase for extended periods of time. Since G0 phase is a state in which cells are not actively dividing or preparing to divide, this behavior likely helps these cancer cells “hide” from the typical treatments that target rapidly dividing cells.
To make a bit of an oversimplification, cancer is essentially the unchecked division of cells; though there are many sneaky tricks that cancers accumulate to continue to grow and travel around the body. For this reason, the most typical kinds of cancer treatments target populations of cells that are rapidly dividing and proliferating. Since BCSCs do not act in this typical manner, they can escape these more typical treatments. BCSCs are then free to divide asymmetrically later with some daughter cells proliferating into the more typical tumor cells that rapidly divide, and others retaining this stem cell like character. This characteristic may be the reason that cancers recur- CSCs evade treatment when in their “dormant” (G0) state, making us think the cancer is all gone, but later give rise to the more typical cells that cause the tumor cells we are trying to fight off.
The current paper by Ogino et al. dives deeper into the problem of these CSCs in an attempt to better understand their underlying mechanisms and to create a new kind of treatment to target BCSCs specifically. Previous studies by the team investigated 4T1 cancer cells, a line of mouse breast cancer, and were able to group the cell line into 2 groups- those that behaved like “normal” tumor cells, and those that exhibited the above stem cell-like properties (a high capacity for self-renewal and differentiation) and were referred to as breast cancer stem-like cells, or BCSCs. These BCSCs identified within the 4T1 breast cancer line had abnormally high levels of aldehyde dehydrogenase (ALDH) activity and are considered ALDH+.
Upon further investigations, researchers have found such extensive links between stem-ness and elevated ALDH activity that high ALDH is now considered a marker for BCSCs. Notably, one commonly used breast cancer drug, cyclophosphamide, targets cells specifically with low ALDH activity, which may further exacerbate the problem of heterogeneity by allowing these stem-like cells to thrive. ALDH catalyzes the oxidation of aldehydes into carboxylic acids and is believed to help protect against oxidative stressors (such as reactive species like alcohols and aldehydes that our cells have to process and dispose of) as well as cytotoxic assaults elicited by chemotherapeutics (Edenberg & McClintick, 2018). High levels of this enzyme, ALDH, which catalyzes the process of detoxification therefore protects these cells from normal cancer treatments and promotes prolonged survival. Further observations by the research team revealed that ALDH activity varied in a time-dependent manner, which lead researchers to investigate possible molecular level interactions with the circadian system that might be correlated with upregulation of ALDH.

Figure 2. (Ogino et al., 2021) Graphical representation of relative amounts of ALDH+ cells within the 4T1 cancer cell line. The above shows that cells with increased expression of CLOCK protein, a key circadian regulator, had the lowest relative expression of ALDH activity. This indicates the probability of CLOCK having some inverse role in regulation or connection to ALDH expression levels.
To further examine the role that the circadian system might play in ALDH overexpression, authors inserted various key genes responsible for circadian rhythms into the 4T1 cancer cells and monitored the relative amounts of ALDH+ cells. They found that the cells with higher expression of the CLOCK protein had the greatest relative decrease in ALDH+ cells (Fig. 2), essentially showing that cancer cells with excess of this circadian gene do not have as elevated ALDH. Additional analysis of CLOCK mRNA and protein levels in ALDH+ vs. ALDH- cells revealed a significantly lower expression of CLOCK in the ALDH+ cells, indicating to researchers that the loss or down regulation of CLOCK may be implicated in the overexpression of ALDH and subsequent stem cell-like behaviors. A luciferase assay also confirmed lower CLOCK binding activity to its target genes, indicating less CLOCK activity in these ALDH+ cells.
So what if we “supplement” cancer cells with CLOCK?
The above preliminary investigations uncover an inverse relationship (that is, when one goes up, the other goes down) between CLOCK expression and ALDH+ cells with the associated cancer stem-like cell phenotype. The next step was then to see if this was a causal relationship or merely a correlation. To tell if the deficiency in CLOCK is the cause of ALDH overexpression and subsequent stem cell like properties, researchers devised a way to “supplement” the ALDH+ cells with the CLOCK gene to see if it would restore the “normal” cancer cell phenotype. Researchers found that using a specific virus to deliver the Clock gene into these ALDH+ cells was in fact a feasible way to increase functional CLOCK protein levels without disrupting the normal circadian fluctuations in its expression (Fig. 3).

Figure 3: (Ogino et al., 2021) Luciferase data showing the oscillatory circadian expression of CLOCK protein after transduction by the authors.

Figure 4. (Ogino et al., 2021) Western blot (top) and bar graph schematic of mRNA levels, showing much higher mRNA and protein expression in CLOCK transduced cells. p84 is a control used to normalize protein expression.
This finding was an important first step to confirm a way to supplement CLOCK to the ALDH+ cells without altering the way that CLOCK is normally expressed, which let authors further assess if supplying excess CLOCK was sufficient to restore a more typical cancerous phenotype (one that is treatable with current drugs) which would lower the overall fitness of the cancer. With this possibility, researchers began to see if supplementing CLOCK to these BCSCs could reduce the expression of ALDH, eliminate “stem-ness”, and subsequently mitigate the cancer’s ability to grow and spread. After lentiviral transduction (supplementation) of the CLOCK gene into these cancer cell lines, the authors found that the ratio of ALDH+/ALDH-negative cells was much lower, meaning there were far fewer cells that were overexpressing ALDH (Fig. 4). With this ability to manipulate the number of cells over expressing ALDH by supplementing CLOCK, researchers could begin to investigate if the overexpression of ALDH was indeed driving cells to act stem-like, or if this was just a correlation.

Figure 5 (Ogino et al., 2021) relative levels of mRNAs known to be associated with “stem-ness”. This figure shows how the cells supplemented with CLOCK have a much lower expression of “stem-ness factors”.
Upon analysis of mRNA expression within these cancer cell lines, populations with CLOCK expressed significantly lower amounts of “stemness” related factors, which are essentially markers for multipotency that offer a quantitative assessment of how “stem-like” a cell may behave (Fig. 5). Furthermore, these CLOCK transduced cells exhibited a slower growth rate and lower spheroid formation in culture, as shown in Fig. 6. Spheroids in this circumstance are populations of cells growing in 3D on media, which is a good testament to how well these cells would be able to grow in live tissue.

Figure 6: (Ogino et al., 2021) 2E- growth rates of cancer cells with CLOCK supplemented are significantly lower than those without supplemented CLOCK, 2F- Spheroid growth assay, showing the cell population with CLOCK supplemented have fewer spheroids growing (spheroids appear blue on images to the left), and smaller spheroids than the cell population without CLOCK supplemented (bar graph accounts for number and size of spheroids).
Keeping in mind the end goal, if we could target cancer treatments to attack the BSCSs, this could cause slower growth of the cancer over all by reducing the cancer’s ability to continually accumulate mutations that allow for faster growth and escape from common treatments, which could be an amazing way to treat heterogeneous cancers. But it is not just the growth rate of cancers that makes this disease so hard to treat, it is also the invasiveness of the cells (their ability to take over neighboring tissues), and the metastatic potential of the cells (their ability to migrate around the body, recolonize, and grow in new areas).
Upon assessment of the slower growth they were able to cause by supplementation of CLOCK (Fig. 6), researchers next turned their sights on the cancer’s invasiveness after CLOCK supplementation using two assays: a collagen type I TGF(beta)-1 induced invasion assay, and a spheroid invasion assay, both of which assess the cancer cell’s ability to grow and expand outward beyond where normal cells may stay put after being seeded (when cells are placed into the growing medium). After CLOCK transduction, both types of assays showed much less invasive potential (as seen in Fig. 7).

Figure 7: (Ogino et al., 2021) A. Invasion assay of cancer cells showing that populations receiving the CLOCK supplement are much less invasive(left images), with quantitative r=confirmation of less area being occupied by CLOCK supplemented cancer lines. B. Spheroid invasion assay images, showing qualitative observations of much less invasion and protrusion occurring from the cell spheres supplemented with CLOCK (bottom images). C. Western blot analysis of endothelial (less invasive cell type) markers E-cadherin and Claudin1, seen to be expressed more in CLOCK supplemented cells (right) than non-supplemented counterparts(left). Additionally, cancer cells not supplemented with CLOCK exhibit higher expression of mesenchymal marker, Vimentin (more invasive type).
Next, to assess the cancer’s migratory ability, researchers looked into markers that were indicative of whether the cells were in more of an endothelial or mesenchymal state. This is significant as EMT, or Endothelial to Mesenchymal Transition, which is a transition that cancer cells make to take on a more “migratory state”, further increasing invasive potential to reach distant sites of the body. Rather than being anchored to a certain area or tissue and exhibiting a more endothelial nature, after undergoing EMT cells begin to express mesenchymal factors rather than endothelial, which allows them to disconnect from whatever tissue they were connected to and travel in the bloodstream to begin colonizing other tissues. The finding that CLOCK-transduced ALDH+ cells expressed a significantly higher amount of endothelial markers rather than mesenchymal was therefore a good sign of reduced invasive potential, which was contrasted by the finding that populations not transduced with CLOCK expressed more mesenchymal markers (i.e., they were more invasive).
Seeing the success of CLOCK expression in vitro, experiments that use cells in a dish, researchers were able to begin testing his method in vivo by implanting these cancer lines into the mammary fat pads of mice to observe how this cancer would grow in a live animal after supplementing with CLOCK. The results found in vitro carried over into the in vivo model, with slower tumor growth, and less invasive potential. Taken together, these factors indicate an overall less malignant type of cancer when transduced with CLOCK in this cancer line (4T1). Figure 8 shows multiple assessments of tumor growth and malignancy, each of which supports the notion that CLOCK transduction leads to lower malignancy and growth rates. These measurements include measuring tumor diameter, immunohistochemistry (staining for a marker of cellular division), assessment of number and size of metastases in lungs, and colony growth after plating.

Figure 8: (Ogino et al., 2021)- A. Measurements and images of tumor volume after cancer cell implantation in mouse models. CLOCK supplemented cancer cell lines are consistently smaller than non-supplemented counterparts. B. Immunohistochemistry staining of CLOCK supplemented (bottom) vs. non-supplemented cancer cell lines. Authors stained for Ki-67+ cells (appearing pink/red), which indicates cells preparing for division and is frequently used to assess cancer progression. As seen qualitatively in images to the left, and quantitatively on the bar graph to the right, CLOCK supplemented cells have lower Ki-67+ levels, which is associated with a less severe cancer. C. Images and quantitative analysis of metastasis to the lungs after cancer cell injection shows CLOCK supplemented cancer cells exhibit less lung metastasis. D. Assessment of growth of metastatic colonies isolated from mice after cancer cell injection indicate less growth occurs with CLOCK induced cancer lines.
It works, but how?
After in vitro and in vivo experiments, authors could tell that CLOCK levels were much lower in these ALDH+ stem-like cancer cells, though supplementing CLOCK was sufficient to reduce stem cell like properties, leading to a slower growth rate and less metastasis. But how? To answer this, researchers examined whether CLOCK was repressed prior to, or after transcription, the process in which the information encoded by DNA is converted into mRNA and exported from the nucleus of the cell. There is only once copy of DNA per cell, so it must be “kept safe” and cannot leave the nucleus. Instead, cells have a system of copying the code of DNA into another similar molecule, RNA, that can leave the nucleus to transfer genetic information to the components of cells that will actually make the proteins encoded for in DNA. While it may seem redundant to make a copy of the genetic information in a slightly different molecule, it goes to show how important it is that DNA is kept safe in the nucleus and allows for just the needed region of DNA to be exported as often as needed. Though researchers knew that there was a lower amount of the CLOCK protein in these ALDH+ cells, they we not sure if it was because the DNA was not being encoded and exported to RNA (transcriptionally regulated), if the RNA was not getting translated into a protein (post transcriptional control) or, if the protein was being excessively degraded after its synthesis (post-translational).
To identify how CLOCK was being repressed in ALDH+ cells, researchers assessed levels of CLOCK mRNA in the ALDH+ cells compared to 4T1 cancer cells with normal ALDH expression. Given that the ALDH+ and ALDH- cells had similar levels of expression of the CLOCK mRNA, researchers could deduce that the regulation was not occurring transcriptionally, as both populations of the 4T1 cancer cells had similar levels of CLOCK mRNA. There had to be some mechanism in which the mRNA was inhibited from being translated into a fully functional CLOCK protein in the BCSCs expressing high levels of ALDH. As you might guess from the title, they found that CLOCK is repressed post transcriptionally in the ALDH+ cells through the binding of a micro RNA, miRNA-182. Essentially, this little non-coding RNA binds to the 3’ region of the CLOCK mRNA to prevent the mRNA from being translated into a functional protein. This shows how the problem is not in the CLOCK protein itself, but the regulatory mechanisms that impact its ability to act as a functional protein in the circadian system. Somehow, elevated ALDH levels are correlated with higher expression of this miRNA, which then binds to the CLOCK mRNA to inhibit its translation into a functional protein. See a brief overview of micro-RNAs below in Fig. 9.

Figure 9: Schematic of structure and function of miRNAs. miRNAs (orange) bind to mRNAs and inhibit their transcription by the ribosome, therefore stopping the associated protein from being expressed in the cell. Credit: Wikipedia; KelvinSong, Creative Commons.
Researchers were able to come to this conclusion by completing multiple luciferase assays, each targeting a different section of the regulatory regions of the CLOCK gene to determine where regulation of the CLOCK mRNA was occurring. By comparing the luciferase assays between ALDH+ and ALDH- cells, researchers could identify where regulation occurred by identifying the region that showed the biggest difference in luciferase expression between these two cell types. Upon identifying the location where regulation occurred, researchers were able to use this information and other known criteria of the mechanism of regulation to narrow down the known pool of miRNAs to identify which one may be imposing control over CLOCK expression. With the use of three specific criteria, Ogino et al. identified miRNA-182 as the miRNA responsible for post-translational inhibition of CLOCK in ALDH+ cells.
To confirm the role of miRNA-182 was indeed what they thought, researchers created a knock out (KO) cell line with depleted levels of miRNA-182, and injected these 4T1 cancer cells into mice. If miRNA-182 was responsible for the downregulation of CLOCK, depleting miRNA-182 should allow CLOCK levels to return to normal, and restore cancer cells to a less stem-like state. Compared to the unaltered 4T1 strain, mice that received an injection of miRNA-182 KO cells exhibited lesser tumor volume, fewer metastatic colonies, and a reduced area of metastatic colonies (as seen in Fig. 10) which supported the belief that miRNA-182 was responsible for downregulation of CLOCK. Additionally, expression of miRNA-182 was drastically elevated in tumor cells compared to other tissue types, which further supports the idea that this miRNA may play an important role in or be an effect of the elevation of ALDH, and subsequent stem-ness in this cancer cell population (Fig. 10).

Figure 10. (Ogino et al., 2021) Similar to Fig. 8 above, this figure assesses tumor size (A), metastasis (B), and metastasis growth (C), in each of which CLOCK supplemented cells grow slower and metastasize less. Panel D shows the abundance of miRNA-182 expression in tumor cells, further supporting the hypothesis that it may act in ALDH+ cancer cells to suppress CLOCK activity.
In total, the above work shows multiple ways that we may be able to target cancer stem-like cells of this particular cancer cell line. Authors show 2 main ways that reduced overall cancer growth: by supplementing CLOCK, or knocking out the miRNA that blocks CLOCK expression. While the expression of certain genes and miRNAs may not be the same in every cancer type, this paper shows an innovative way to re-examine cancer treatment by pinpointing a certain characteristic (in this case, “stem-ness”) and taking advantage of the complex interconnectedness of this characteristic with the molecular workings of circadian control.
Previous work has identified a somewhat ambiguous relationship between circadian control and cancer progression, though this current work takes it a step further by treating cancers indirectly through the ties and dysregulation that they cause to the molecular level circadian components. This “indirect” way of treating cancer may prove to be an incredibly valuable way to target specific attributes of different cancers based on each one’s individual properties and characteristics that aid in their malignancy and growth potential. In this case, attacking stem-ness through its connection with the circadian component CLOCK seems to mitigate growth rate and metastatic potential of the cancer by preventing cancer cells from accumulating mutations thanks to stem-cell like behavior (hierarchal model of heterogeneity), remaining dormant, and later reappearing and/or metastasizing. Though there is much that we still do not completely understand about cancers, and there are possibly other avenues separate from circadian components that could be leveraged to target idiosyncratic properties of other various cancers. See a summary figure of the authors’ findings in Figure 11.

Credit: Ogino et al., 2021
Annnnd that’s it for this post. Please make sure to leave a comment below and let us know what you thought of the paper and this write up. Until next time, stay curious!
Student JC: Chronic circadian disruption modulates breast cancer stemness and immune microenvironment to drive metastasis in mice
Welcome to our Journal Club! I use this as a forum for open discussion about the paper in question. Anyone can participate in the journal club, and provide comments/critiques on the paper by leaving a comment below. This is the first post written totally by a guest author, lab member Leah Boyd! I wanted to re-start this journal club with posts from students in the lab, so hopefully this will be the first of many posts to come.
We all know that the effects of jetlag are pretty miserable—the fatigue, bizarre sleep schedule and desire for meals at odd hours of the day come with every transmeridian flight. But in 2019, Eva Hadadi, Hervé Acloque and colleagues at various French universities found that chronic jetlag and circadian rhythm disruptions (CRD) can moderately affect primary tumor development and significantly increase cancer-cell dissemination and metastasis in breast cancer. Their paper, entitled Chronic circadian disruption modulates breast cancer stemness and immune microenvironment to drive metastasis in mice, gives a good overview of what they found.

(Credit: Bob Al-Greene/Mashable)
Previous research has alluded to correlations between circadian rhythms and cancer development, and the International Agency for Research on Cancer classified CRD as a probable carcinogen in 2007. Van Dycke et al. performed a study in 2015 that showed p53 mutant mice (with p53 only deleted in the mammary gland) who experienced CRD developed mammary tumors eight weeks earlier than they typically would. But what happens after the tumors develop?
Hadadi et al. wanted to study beyond tumorigenesis and see how CRD affects tumor progression, cancer-cell dissemination and immune phenotype. They used the MMTV:PyMT model of spontaneous murine mammary carcinogenesis to test the impact of chronic CRD at the beginning of puberty-initiated tumorigenesis.
To start off, Hadadi et al. divided mice carrying MMTV:PyMT and MMTV:LUC transgenes (which express bioluminescent luciferase to tag the PyMT+ tumor cells) into two groups when they were at 6 weeks. For 10 weeks, the first group, which I’ll call the control group, experienced normal light and dark periods—12 hours of light, 12 hours of dark—while the other group faced an 8 hour reduction in the dark period every other day, which was designed to mimic the effects of night shift work or recurrent eastbound transmeridian flights. (Why does this matter? Previous research suggests that circadian rhythm is more altered by advances rather than delays in time.) Using in vivo imaging, they found that there was no major difference in the onset of tumorigenesis between the two groups but that the tumor burden and growth was significantly higher in the jetlag mice. Additionally, the lesions in the jetlag mice were more malignant (moved around the body more), even though the researchers observed multiple tumor grades in the primary tumors of both groups (Figure 1).
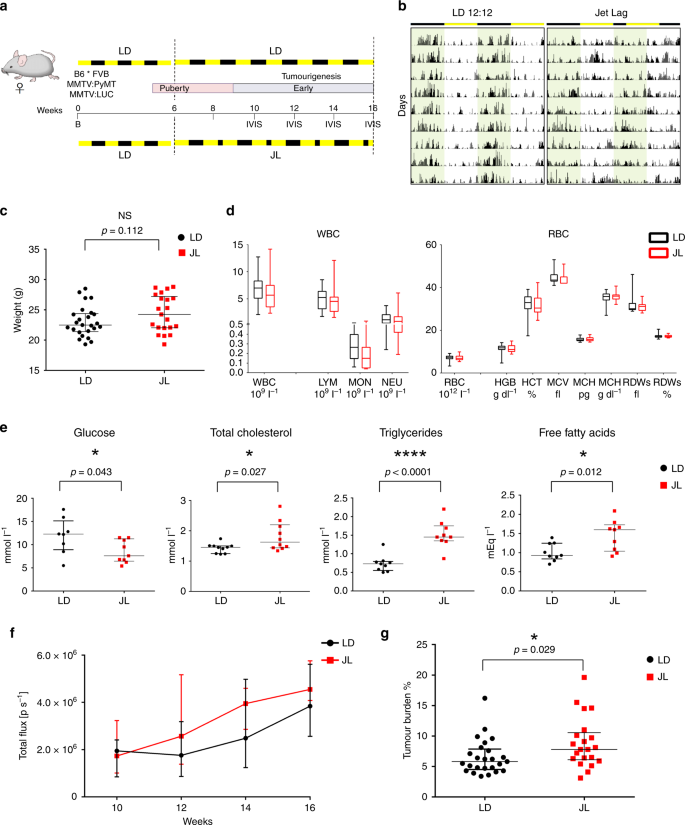
Figure 1: a. Experimental timeline for evaluation of the effect of chronic jet lag on spontaneous mammary tumorigenesis in B6*FVB PyMT mice. b. Tumor growth monitoring using bioluminescence. c. Weight at sacrifice of mice in LD and JL conditions. d. Blood cell counts: total numbers of white blood cells and red blood cells in LD and JL mice. f. Timeline of tumor growth in total flux measured by in vivo bioluminescence imaging in LD or JL groups. g. Tumor burden (tumor to body weight ratio) as % in LD or JL conditions. (Source: Hadadi et al., 2019)
The researchers used the same mice to explore if chronic CRD affected cancer-cell dissemination. They found a significant elevation of transgene expression in the bone marrow of the jetlag mice; in fact, the jetlag mice had an almost two-fold increase in disseminating cancer cells (DCCs) in the bone marrow. Flow cytometry analysis analysis showed an increase of circulating cancer cells in the bloodstream of the jetlag mice. Bone lesions demonstrated that cancer cells were further disseminating to bone (Fig. 2). Metastasis was much more prevalent in the jetlag mice (52%) than in the control group (28%), a result consistent with the aforementioned findings. CRD clearly promotes metastasis-but what elevates the risk for metastasis? (Clock genes. You’ll find out more later.)
A hierarchical clustering analysis on five jetlag and five control mice showed that a few genes were significantly differentially expressed between the two groups. But the genes with the greatest differential expression, including Rhodopsin and Gnat1, weren’t related to circadian cycles at all; they were actually linked to photoperception and phototransduction. Interestingly, they were downregulated in the primary tumor and mononuclear bone marrow cells of jetlag mice compared to the control group. The researchers noted that it’s unclear whether this finding was because of (a) the circadian rhythms of the control mice or (b) the peripheral tissues play a genuine functional role in phototransduction (or another unknown process these genes control). It will require deeper investigation by researchers.

Figure 2. a. Representative gating strategies for mammary stem cells (MaSC) with contour plots shown for LD (black) and JL (red) tumors. b. Frequency of mammary stem cells in LD and JL tumors. c. Mammosphere-formation efficiency of LD and JL tumor cells. (Source: Hadadi et al., 2019)
Additional data suggest that CRD promotes stemness of primary tumor cells. (By stemness, we mean the ability of a cell to generate differentiated daughter cells and continue its lineage.) The researchers looked at the expression of known markers of mammary cancer-cell stemness and found a significant upregulation of genes associated with the epithelial-mesenchymal transition (EMT), a process where epithelial cells essentially gain the properties to become stem cells. By performing a mammosphere-formation assay—which tests stem cell activity in mammary tissue—the researchers found that mammosphere-formation efficiency (MFE) was much higher in cancer cells from the primary tumors of the jetlag mice (Figure 2). The jetlag mice also showed a decrease in Per2 expression, a gene that increases mammary epithelial and cancer cell stemness. Furthermore, the stemness of the mammary epithelial cells was actually regulated by circadian oscillations of the clock genes. There was a negative correlation between the peaks of PER genes, which peak in the dark, and MFE. Grafted cancer cells purified from the jetlag mice showed an increased tumor-initiating potential in immunocompetent wild-type mice compared to cells from the control mice.
Using flow cytometry, the data show there are reduced numbers of CD45+ immune cells in tumors in the jetlag mice, but there was no major alteration in the proportional distribution of various types of immune cells. However, tumors from jetlag mice had a significantly higher proportion of MCH II-low tumor-associated macrophages (TAMs), which support tumor growth. The jetlag mice also showed high numbers of immunosuppressive CD4+FoxP3+Treg and an elevation of the Treg/CD8 and CD4/CD8 T cell ratios, which are indicators of therapy responsiveness and breast cancer survival. Chronic CRD weakens anti-tumor responses and promotes an immunosuppressive pro-tumor microenvironment. This environment may promote the dissemination of mammary cancer cells and the formation of lung metastasis.
Next, a polymerase chain reaction (PCR) showed that the most downregulated cytokines/chemokines in the primary tumors from jetlag mice are known to favor an anti-tumor immune response. Consistent with the above flow cytometry data, the most upregulated ones are connected to immunosuppression and tumor progression. They injected an inhibitor for CXCR2—a receptor for CXCL5, which promotes cell metastasis through tumor angiogenesis—into another group of jetlag mice and found a decrease in lung metastasis and the amount of PyMT-positive DCCs in the bone marrow. The CD4/CD8 ratio was much lower. This suggests that using a CXCR2 inhibitor could help limit the effect of jetlag on cancer-cell dissemination and metastasis, but this is merely a conceptual finding, and further studies will definitely be required to analyze its ability as a therapy.
It’d be interesting to do more research into the metabolic implications of CRD. While the researchers found a significant increase in plasma lipid levels in the jetlag mice, they only found minimal differences in weight and insulin levels, which the researchers associate with the timeframe of their study and continuous feeding of the jetlag mice. What are the associations between CRD conditions and weight gain, type 2 diabetes and other conditions associated with inconsistent insulin levels? This would require a longer-term study and a method of feeding the jetlag mice that doesn’t minimize physiological differences between awake and rest cycles.

Figure 3. CRD increases the proportion of cancer stem cells (dark blue) and alters the tumour microenvironment by recruiting myeloid-derived suppressor cells (yellow), which creates a suppressive tumour immune microenvironment (TIME), which could relate to the enhanced CXCL5-CXCR2 axis in the TIME. These effects result in increased dissemination and metastasis in bone marrow and lungs. Inhibition of the CXCR2 axis is able to lighten the effect of CRD and promote anti-tumour activity. (Source: Hadadi et al., 2019)
If there’s one big finding to take away from this study, it’s that CRD leads to enhanced cancer-cell dissemination and metastasis. When clock genes undergo altered expression, there are increased risks of cancer severity and metastasis, particularly as the researchers looked at Per2 and Cry2 clock genes. CRD also enhances the tumor-initiating potential of local cells and creates an immunosuppressive local environment. A graphic shows it better than I can (Figure 3).
Annnnd that’s it for this post. Please make sure to leave a comment below and let us know what you thought of the paper and this write up. Until next time, stay curious!
My Top 5 'Coolest' Studies of 2019
Merry Christmas and Happy Holidays to everyone! I hope you all have a great new year :) I thought it would be fun to share my top 5 coolest studies of 2019 to round out the year! (as I did last year) This is not a list of the ‘best’ studies of the year, as that is extremely hard to quantify (although all of these are pretty stellar), so they are in no particular order. This is simply a list of papers that I thought tackled some interesting problems in a unique way, or made significant technological advances in the field. The work described in these papers makes you think ‘wow…science is really crazy!’ Many of them are from the latter half of the year as they are the freshest in my mind! I hope you enjoy checking them out as much as I did. Click the paper titles for direct access to them. (Note: these are in no particular order)
5. Glutamatergic synaptic input to glioma cells drives brain tumour progression
This paper, from Frank Winkler & Thomas Kuner’s labs, complemented another few studies in the same issue of Nature (see my journal club paper on one of them here). This series of studies demonstrated that deadly brain cancer cells (glioma) form bona fide functional synapses with neurons in the brain. Even crazier…these connections (and subsequent synaptic stimulation) potently help the cancer grow! Future studies of so called ‘neuroglioma synapses’ will prove invaluable in understanding and treating this extremely deadly disease.

A schematic representation of neuroglioma synapses. Neurons form AMPA-receptor receptor dominated glutamatergic synapses with growing glioma cells. Synaptic stimulation causes activation (depolarization) of cancer cells and large increases in intracellular calcium. This signal is propagated throughout the glioma network via gap junctions linking cancer cells together (Credit: Venkataramani et al., 2019)
4. Undulating changes in human plasma proteome profiles across the lifespan
What does ‘aging’ actually mean? If you took a blood sample from an 80 year old and a 20 year old, could you tell which sample came from each person just from the molecules in their blood? Tony Wyss-Coray’s lab was interested in understanding this question, and more generally, how we age biologically. To do this, they looked at thousands of proteins (critical molecules that do virtually everything in our bodies) in human blood, categorized them, and tracked how they changed throughout an entire lifespan (see below). They found remarkable patterns in the concentrations of blood proteins that change in non-linear ways throughout aging. This large study opens up a new area of research focused on understanding the role of many of these proteins in aging, and will likely lead to novel biomarker and drug target discovery for age-related diseases.

Waves of aging proteins across the lifespan. Thousands of proteins show age-dependent changes in expression in blood, with peaks noted at age 34, 60 and 78 (credit: Lehallier et al., 2019).
3. Deep Learning Reveals Cancer Metastasis and Therapeutic Antibody Targeting in the Entire Body
Patients with cancer usually die not due to the primary tumor, but because of metastases that cause dysfunction throughout the body. A major problem in tackling metastasis is finding where tumor cells have traveled…a problem that is an order of magnitude harder than finding a needle in a haystack. Cancer is insidious…a single or few surviving cells that a doctor may have missed due to limitations in technology can expand back into full blown cancer. So, finding these tiny metastases is critical if we want to save more people that fall victim to malignant disease.
To more accurately detect metastases, Ali Ertürk and colleagues combined a few exciting techniques to get a whole-body view of metastatic cancer spread. This technology, termed “DeepMACT” (see video abstract below) uses an artificial intelligence/machine learning approach in combination with whole-body tissue clearing to detect tiny metastases throughout the whole organism. Additionally, this technique can be used to quantify the efficacy of antibody-based therapies against cancer. This new technology will be used to make significant strides in understanding and combating metastases, and aide in high-throughput drug design and validation for the treatment of various malignancies.
2. Cortical column and whole-brain imaging with molecular contrast and nanoscale resolution
A major hurdle in neuroscience research is visualizing the brain at the resolution that neural computation occurs. This happens at the micron or sub-micron scale, which is at or below the capabilities of conventional microscopes. Several years ago, Ed Boyden’s team tackled this problem with a unique approach termed “expansion microscopy”. This technique essentially turns the brain into one of those expandable water toys (Grow Monsters), allowing researchers to isometrically ‘blow it up’ so nanoscale structures are now up to 20x bigger! This allows very fine structures like dendritic spines to be imaged with conventional microscope technology.
This solved a major problem, imaging tiny structures with molecular contrast. However, if you want to get super-resolution images, that would ‘bleach’ (damages) the sample too quickly for any sizable amount of data to be collected. To address this problem, Ed Boyden and Eric Betzig’s labs combined two technologies: expansion microscopy and lattice light sheet microscopy (LLSM). By combining these techniques, the researchers are able to image a whole brain at super-resolution (resolving structures that are < 1/200th the width of a human hair) with multiple molecular markers in as little as 2 days, with a resolution of 60 x 60 x 90 nanometers for 4× expansion! Check out the amazing video below as an example of what the technology is capable of.
1.Estrogen signaling in arcuate Kiss1 neurons suppresses a sex-dependent female circuit promoting dense strong bones
I first heard about this research from the senior author, Holly Ingraham, at the Society for Behavioral Neuroendocrinology (SBN) meeting this past year. I thought the work was so cool that I’ve decided to include it in my list for 2019. The overarching research question was simple enough, how does estrogen signaling in the brain regulate energy expenditure, energy balance, and systemic physiology in females? This is a critical question as a major problem for postmenopausal women (with drastically reduced estrogen) is deterioration in metabolic function, bone density, among other phenomena. Prior work had pointed to a role for neurons in the hypothalamus expressing the estrogen receptor alpha (ER-alpha) in controlling whole-body physiology in females. However, the localization of these neurons and their role in bone physiology was essentially unknown.
Ingraham’s team used adeno-associated viral vectors (AAVs) to knock out ER-alpha in multiple hypothalamic nuclei, and found that doing this in the arcuate nucleus caused mice to develop very thick bones throughout their bodies! See the figure below (panel f) to see how much thicker the bones are in the ERalphaKO (arcuate) than in control mice. They further demonstrated that the neurons that govern this effect also express the neuropeptide kisspeptin, as when they knockout ER-alpha in these neurons they could recapitulate the bone-growth enhancing effect. Importantly, these effects were only found in female mice, indicating a strong sex-dependent effect of estrogen signaling in the mediobasal hypothalamus! This work reveals a previously unknown target for treatment of age-related bone disease, and suggests that sex-dependent treatment modalities may offer the best strategy for ameliorating bone loss.

ER-alpha expressing neurons in the arcuate nucleus powerfully regulate bone density only in female mice. These findings offer a previously unknown target for the treatment of age-related bone disease. (Credit: Fields et al., 2019).
BONUS: The “sewing machine” for minimally invasive neural recording
This last one is a special bonus that I did not include in the main list because it is (as of writing this) still a pre-print and has yet to be peer-reviewed. Nonetheless, I think the idea and approach that the authors devised is really cool, and worth discussion. Surgeries for minimally invasive neural recording are very hard to do, and very hard to standardize across repeated procedures. To tackle this problem, Philip Sabes and colleagues developed a neural ‘sewing machine’ to sew fine electrodes into the mouse brain (see the schematic below). The system is able to perform rapid and precise implantation of probes, each individually targeted to avoid observable vasculature and reach diverse anatomical targets. I’m keeping my eye on this one, especially with the author’s connection to Neuralink…this may be a peek into the future of brain-machine interfaces!

A schematic of the neural ‘sewing machine’ for chronic recordings of diverse neural activities (credit: Hanson et al., 2019).
Annnnndddddd….that’s it for the year! There were many more studies that I wish I could have included, but I wanted this to be a quick read…not an epic novel. With that said, I’m off to enjoy the NYE parties…see you all next year! Leave a comment below, and, as always, stay curious! —JCB.
Stress-induced metabolic disorder in peripheral CD4+ T cells leads to anxiety-like behavior
Welcome to our Monthly Journal Club! Each month I post a paper or two that I have read and find interesting. I use this as a forum for open discussion about the paper in question. Anyone can participate in the journal club, and provide comments/critiques on the paper by leaving a comment below. I picked this month’s paper because it details an enormous and beautiful study examining how the immune system communicates with the brain to promote anxiety. The paper we are discussing is titled “Stress-induced metabolic disorder in peripheral CD4+ T cells leads to anxiety-like behavior” (click the hyperlink to see the paper) by Jin Jin & colleagues at Zhejiang University in China.
We have all experienced stress. Whether it’s from an upcoming exam, a public performance, or the existential dread experienced day-in and day-out for so many people around the world :) . If stress goes unchecked, it can lead to the development of anxiety, where we start to feel stressed in situations that don’t usually call for this kind of response. How does a stressful experience precipitate anxiety? Why do some people develop anxiety under stress, while others seem resistant?
Many studies have demonstrated that chronic stress negatively influences the immune system. However, it is unclear whether these changes causally contribute to the development of anxiety. Additionally, whether immune-related anxiety is driven by the innate or adaptive immune system remains an unexplored area. Jin Jin and colleagues set out to answer these open questions using a mouse model of chronic stress. To produce stress, the authors subjected mice to brief daily electronic foot shocks (5 times for 3 sec per day for 8 days; ES).

Figure 1: CD4+ T cells play a major role in the development of stress-induced anxiety-like behavior. Mice were given injections of control antibody (IgG), anti-CD4, or anti-CD8 to deplete two major subtypes of T cells. IN a separate group, wild-type (WT) mice were compared to those lacking B and T cells (Rag1-/-). They were given daily electric footshocks (ES) for 8 days to elicit stress responses. A day later, mice were tested for the development of anxiety like behavior in an open field test. Rag-/- mice showed no anxiety like behavior following footshock stress (Panel B), and similarly, mice with their CD4+ T cells ablated also didn’t show anxiety like behavior (panel C). Credit: Fan et al., 2019
In this paradigm, normal mice (wild-type; WT) or those lacking an adaptive immune system (Rag1-/-) were subjected to multiple foot shock sessions over the course of 8 days, and then their behavior was tested for signs of anxiety the following day (see Figure 1). To do this, the authors took advantage of a mouse’s natural tendency to stick to the edges of any area that it is in, avoiding open areas (i.e., thigmotaxis). In this ‘open field test’, WT mice stuck to the edges of the arena much more following electric foot shock-induced stress (i.e., they were more scared of entering the center of the arena). However, Rag1-/- mice showed equivalent anxiety-like behavior regardless of whether they were subjected to prior stress or not. This indicates that the immune system plays a role in the generation of anxiety. To test which cells likely drove this response, the authors depleted two different major types of T cells (CD 4+ helper T cells and CD 8+ cytotoxic T cells) using antibodies against CD4 and CD8. When they did this and then subjected the mice to their stress protocol, mice given control antibodies and those with CD8 cells depleted showed anxiety-like responses in the open field, just like WT mice. However, mice given anti-CD4 antibodies no longer showed any signs of anxiety! This indicates that CD4+ T cells are important in driving anxiety like behavior in response to chronic stress!

Figure 2: RNA-seq of T cells reveals altered gene expression in CD4+ T cells in response to chronic electric footshock stress (Panels A-D). These differentially expressed genes largely contribute to mitochondrial function. On tests of energy production, CD4+ T cells from stressed mice showed severely impaired glycolytic and oxidative phosphorylation capacity (Panel E). (Credit: Fan et al., 2019).
To investigate this finding further, the authors began to look deeper into CD4+ T cells and how they change in response to chronic stress. Using RNA-seq, they were able to identify 128 differentially expressed genes in CD4+ T cells from stress vs. non-stressed mice (Figure 2). Careful examination of what these genes encoded revealed that many of them were essential to mitochondrial function. As mitochondria are essential for energy production, the researchers tested whether CD4+ T cells from stressed mice showed changes in energy utilization and mitochondrial function. Indeed, these cells from stressed mice showed reduced energy production through the glycolysis and oxidative phosphorylation pathways (Figure 2E). When mitochondria were examined, those in CD4+ T cells from stressed mice showed abnormal morphologies and reduced expression of key membrane proteins (Figure 2G). This suggests that stress-induced mitochondrial dysfunction in CD4+ T cells accompanies the development of anxiety-like behavior.

Figure 3: Disrupted mitochondrial function promotes anxiety-like behavior that depends on CD4+ T cell function. Knocking out the mitochondrial membrane protein Miga2 (Miga2-/-) produces severe anxiety-like behavior, which can be rescued by CD4+ T cell depletion. (Credit: Fan et al., 2019).
What could be precipitating these changes in energy metabolism in CD4+ T cells? Prior research has shown that mood disorders are associated with alterations in omega-6 fatty acid and arachidonic acid (AA) concentrations in the brain. AA is a critical modulator of immune processes via its metabolism to leukotriene-B4 (LKB4) and prostaglandin-E2 (PGE2). When the authors infused each of these metabolites into mice, LKB4 produced pronounced anxiety-like behavior irrespective of whether the mice were stressed or not. This effect seemed to depend on CD4+ T cells, and caused significant changes in mitochondrial morphology and function!
If defective mitochondria and energy production are responsible for the development of anxiety in response to chronic stress, then artificially disrupting mitochondrial function should generate anxiety levels similar to those produced by repeated electric foot shocks. To disrupt mitochondrial function, the researchers knocked out a gene encoding a key mitochondrial membrane protein, Mitogaurdin-2 (Miga2) (Figure 3, Figure 4). When these mice were tested on various behavioral assays, they showed marked signs of anxiety, lending support for the idea that mitochondrial dysfunction drives anxiety-like behavior.

Figure 4: Stress-induced mitochondrial dysfunction in CD4+ T cells promotes anxiety via aberrant increases in xanthine production. Metabolic analyses of serum from WT and Miga2 T-cell KOs (Miga2TKO) revealed marked increases in purine metabolic pathways, and specifically xanthine (~1000x fold increase (10^3)! Xanthine infusions promoted the anxiety like behavior in mice and were drastically elevated in human patients with clinical anxiety. (Credit: Fan et al., 2019).
But how do defective mitochondria influence CD4 T-cells to promote anxiety? The first idea was that in response to stress, T cells aberrantly travel to the brain where they influence neural circuits underlying anxiety. When the authors tested this idea (by blocking CD6 and VLA-4, proteins involved in T-cell migration to brain), they found no evidence that blocking CD4+ T cell migration prevented the development of anxiety. This suggests that instead of T-cells directly traveling to the brain, they release a soluble factor that travels to the brain or causes another cell to influence brain function indirectly.
So, what could these factors be? To investigate this, the authors screened metabolic pathways in normal (WT) and Miga2 knockout mice. They observed marked changes in circulating concentrations of metabolites involved in purine metabolism in the knockout mice (Figure 4). Upon further investigation, they observed large increases in circulating levels of the purine metabolite xanthine (among others) in knockout mice (Figure 4 D,E). Blood samples from humans with anxiety disorders also showed high levels of xanthine (Figure 4 F)! Interestingly, xanthine is a precursor to caffeine and theobromine (a caffeine derivative found in dark chocolate), and xanthine toxicity causes nervousness and tachycardia, which are also observed in patients with anxiety. Similar to the results obtained from infusions of LKB4, infusing mice with xanthine increased anxiety levels, suggesting that disrupted mitochondrial function in CD4+ T cells (in response to LKB4) results in aberrant increases in circulating xanthine which contributes to anxiety.

Figure 5: Miga2 KO mice have increased numbers of oligodendrocytes in the left amygdala, and this is dependent on CD4+ T cells. Knockdown of the putative xanthine receptor AdorA1 (using shRNAs) on oligodendrocytes in the amygdala rescues anxiety-like behavior in the knockout mice. These findings link changes in peripheral immunity and purine metabolism to dysfunctional neural activity and the generation of stress-induced anxiety. (Credit: Fan et al., 2019).
Anxiety, however, is a neurological phenomenon…and so far all we have done is looked at what is happening in the body, not the brain. So, the authors set out to understand how all these changes in the immune system (resulting in elevated xanthine levels) influence neural circuits involved with anxiety (Figure 5). The amygdala is a key brain structure involved in fear and anxiety, so this was a good place to start looking. The researchers observed that Miga2 knockout mice had a larger left amygdala than mice carrying functional copies of Miga2. Based on this finding, they took a deep dive and profiled all cell types within the amygdala of these mice to see how they were altered. Left amygdalae from knockout mice had altered numbers of non-neuronal cells than amygdalae from WT mice. Additionally, infusions of xanthine produced a similar pathology in the amygdala to that of the Miga2 knockouts. Closer examination revealed that knockout mice had many more oligodendrocytes in their amygdala than WT mice, and this could be reversed by depletion of peripheral CD4+ T cells (Figure 5H).
Infusions of xanthine promoted the direct proliferation of oligodendrocytes in the amygdala, suggesting that stress-induced xanthine production promotes aberrant glial cell proliferation in this brain area. Using short-hairpin RNAs (shRNAs), the researchers knocked down the putative receptor for xanthine (AdorA1) specifically on oligodendrocytes within the amygdala (Figure 5I-J). Without this receptor (and therefore without xanthine signaling), KO mice no longer showed anxiety like behavior!

Figure 6: Summary of findings. Stress-induced elevations of LKB4 cause aberrant mitochondrial function in CD4+ T cells. This results in elevations in circulating xanthine levels which signal via A1 receptors on oligodendrocytes in the amygdala. This alters local neural activity to promote anxiety-like behavior! (Credit: Fan et al., 2019).
Together, this giant set of experiments beautifully lays out a complex, multi-system interaction pathway that links chronic stress exposure to the development of pathological anxiety. I am extremely impressed by the sheer number of discoveries in this paper, many of which I did not have time to get to without making this post even longer than it already is! Definitely check out the original paper linked in the opening paragraph if you are interested. An important aspect of this paper is that many of the findings from mouse studies were confirmed in human samples (e.g., circulating xanthine levels in anxiety disorder patients).
Please let me know what you think by leaving a comment below! ‘Till next time, stay curious!
Electrical and synaptic integration of glioma into neural circuits
Welcome to our Monthly Journal Club! Each month I post a paper or two that I have read and find interesting. I use this as a forum for open discussion about the paper in question. Anyone can participate in the journal club, and provide comments/critiques on the paper by leaving a comment below. I picked this month’s paper because it describes a scary phenomenon (brain tumors interlocking with neural circuits!) that could have far-reaching consequences for how we treat brain cancer. This paper, in combination with two others in the same issue, will become classics in the new field of ‘cancer neuroscience’. The paper we are discussing is titled “Electrical and synaptic integration of glioma into neural circuits” (click the hyperlink to see the paper) by Michelle Monje & colleagues at Stanford University. Two other great papers outlining integration of cancer and neural circuits can be found at these links:
“Synaptic proximity enables NMDAR signalling to promote brain metastasis”
“Glutamatergic synaptic input to glioma cells drives brain tumour progression”
Together, these studies provide evidence that cancer cells synaptically communicate with neurons in the brain, and this communication boosts tumor growth! (see the figure below)

Neural activity promotes tumor growth and progression. Glutamate signaling depolarizes (activates) tumor cells that are ‘listening in’ on normal neural communication. (Credit: Barria, 2019).
Below, check out a video of brain cancer cells in a mouse brain expressing a fluorescent activity indicator (GCaMP6s). Spontaneous activity of the cancer cells can be see as waves of green propagating throughout the network. Cell nuclei are labeled red. (Credit: Venkatesh et al., 2019).
High grade gliomas are the most prevalent and deadly of brain cancers in adults and children. Due to their intimate interaction with normal brain tissue, it is extremely hard to eliminate this cancer without destroying the surrounding cells. Significant focus has been on understanding the ‘intrinsic’ mechanisms within the cancer cells that regulate the tumor’s growth and progression. More recently, the role the ‘microenvironment’ plays has come center stage. This includes the cells and extracellular material around and bathing the tumor itself. Michelle Monje’s group demonstrated that this microenvironment is very important for tumor growth as neuronal release of neuroligin-3 is required for glioma growth (click the hyperlink to see the paper). Building on these findings from a few years ago, her group was interested in whether neuronal activity directly influences brain tumor growth and progression. This would require functional synaptic connections to form between neurons and tumor cells.
To examine this, they started to hunt for signs of synaptic connections between these two cell types in primary human tumor samples and mouse models of brain cancer, namely ‘diffuse intrinsic pontine glioma’ (DIPG; see Figure 1 below)

Figure 1: Evidence for functional synapses between neurons and brain tumor cells. In (a) we can see that the expression levels of synapse-related genes (GRIN1, GRIA1,2,3, GRIK2, DLG4, NLGN3, HOMER1) are highly enriched in malignant vs. non-malignant tissues from cancer patient samples. In (b) the data are arranged to see the lineage (x axis) and stemness (y axis) of cells from primary patient samples. In (c) we can see physical signs of synapses using electron microscopy in a human (left) and mouse (right) brain tumor. In (e) and (f) the researchers found signs of synaptic transmission in glioma by labeling the protein post-synaptic density-95 (PSD-95) and synapsin. (Credit: Venkatesh et al., 2019).
Using a variety of methods including transcriptomic profiling, electron microscopy, and immunohistochemistry, the researchers were able to demonstrate signs of the synapses between glioma cells and neurons! This was a great first step…but what are those synapses doing? Are they functional? Do glioma cells propagate neural signals or does the signal ‘die’ when it hits the tumor?
To investigate the functionality of these tumor synaptic connections, Dr. Monje’s group transplanted tumor cells into a mouse's brain and then recorded from these cells during stimulation of a specific neural pathway (Schaffer Collateral). By doing this, they can tell whether the tumor formed functional connections with neurons that innervate that brain area (See Figure 2).

Figure 2: Glioma cells form functional glutamatergic synapses. Mice were transplanted with DIPG tumor cells into the hippocampus (shown in a schematic in (a)). Following some time to allow the tumor to integrate into the tissue, the researchers stimulated a pathway known as the “Schaffer collateral” pathway in the hippocampal CA1 region, which is a very well defined neural pathway in the brain. They recorded any responses to this stimulation in the tumor cells using a recording electrode. In (c-i) the authors demonstrate that stimulating this pathway causes depolarization (change in voltage) in the tumor cells. In (k,l,m) they demonstrate that when they use GCaMP recordings instead of electrophysiology, they can detect large changes in activity in tumor cells following stimulation! (Credit: Venkatesh et al., 2019).
When they stimulated this pathway, they observed large depolarizations (change in voltage that causes action potentials to fire) in the connected tumor cells! This was repeated in several different DIPG models, and was blocked by administration of the drug NBQX, which blocks AMPA receptor signaling. AMPA receptors are fast ionotropic glutamate receptors that play a major role in neural communication throughout the brain. Additionally, when the switched out a recording electrode for a fluorescent indicator of activity (GCaMP6), they observed large increases in tumor fluorescence following stimulation of the Schaffer collateral pathway. This strongly indicates that tumors can form functional connections with neurons, and they talk to each other through classical glutamate AMPAR-mediated signaling! They went on to further characterize ionic communication between neurons and tumor cells using similar techniques as above.
The final and most important question for them to answer was: Does this matter? Does neuron-tumor communication actually influence the lethality or progression of brain cancer? To test this, they implanted tumors cells into the mouse brain (as above) and stimulated neurons in the surrounding area using optogenetics. Then, they analyzed the ‘proliferation index’ of tumor cells in that area, reasoning that if stimulating the neurons in the area promoted tumor growth, then mice that received stimulation would have faster growing tumors than mice that did not receive stimulation. Using the proliferation marker Ki67, they demonstrated that neural activity drives brain cancer progression (see Figure 3)!

Figure 3: Neural activity drives glioma progression. (a,b,c,d) optogenetic stimulation of neurons in the tumor microenvironment promotes tumor growth/proliferation. (e,f,g,h) Over-expressing the AMPA receptor sub-unit GluA2 accelerates brain tumor lethality, and inhibiting GluA2 expression using a dominant negative approach suppresses brain tumor lethality! (i) shows us the big difference between mice with normal levels of GluA2 and those with a non-functioning dominant negative version. (j) Indeed, the tumor burden of mice with reduced AMPA receptor signaling (GluA2-DN-GFP) had a much lower tumor burden than their counterparts with normal levels. This effect was mirrored when AMPA receptor antagonists were used (e.g., Perampanel) instead of the transgenic approach. (Credit: Venkatesh et al., 2019).
To provide further evidence that AMPA receptors are important for neural activity-induced tumor progression, the researchers over-expressed a subunit of the AMPA receptor GluA2 in tumor cells that were transplanted into mouse brains. Then mice were followed to see how long they survived. Mice that had high GluA2 expression (and presumably more AMPA signaling between neurons and tumors) died more rapidly from brain cancer than mice with normal levels of this protein. In the opposite experiment, they replaced GluA2 with a non-functioning version using a dominant-negative approach. This time, mice with non-functioning GluA2 survived significantly longer than their counterparts with normal levels. This suggests that neuron-to-tumor communication through AMPA receptors drives tumor progression and lethality!
The authors moved on to see if there was any evidence that this occurs in living human patients with brain cancer. Indeed, they demonstrated that neurons in brain areas with tumor infiltrations were ‘hyper-excitable’ (Figure 4). This suggests that enhanced brain-to-tumor signaling is a defining feature of glioma infiltrating healthy parts of the brain!

Figure 4: Neurons are extra-excitable in the glioma-infiltrated human brain! (Credit: Venkatesh et al., 2019).
This paper, along with other published in the same issue, form the foundation for what is to become a vibrant field linking cancer and neuroscience! There are a ton of unknowns here…which makes the area ripe for potentially life-saving discoveries! I had a lot of fun reading these crazy papers…but as this is a journal club, let me know what you think by leaving a comment below! Until next time…STAY CURIOUS! - JCB
Dopamine signaling and weight loss - Mechanistic insights from mice, rats, and humans
Welcome to our Monthly Journal Club! Each month I post a paper or two that I have read and find interesting. I use this as a forum for open discussion about the paper in question. Anyone can participate in the journal club, and provide comments/critiques on the paper by leaving a comment below. I picked this month’s paper because it describes a novel approach to combat obesity by targeting dopamine signaling in the hypothalamus. Additionally, I love papers where connections between the brain and body are dissected, and this paper represents a great example of ‘holistic neuroscience’. The paper we are discussing is titled “Hypothalamic dopamine signaling regulates brown fat thermogenesis” (click the hyperlink to see the paper) by Ruben Nogueiras & colleagues at University Santiago de Compostela in Spain.
This is a large study involving converging pieces of evidence from mice, rats, and humans. The authors aimed to investigate how the neurotransmitter dopamine controls metabolism, energy balance, and feeding behavior. There are two primary aspects of feeding behavior that dopamine has been shown to influence. The first is the pleasurable feelings that come along with and reinforce the eating of tasty foods, even when you don’t need to eat (that is, ‘hedonic’ feeding). The other is a balancing of energy stores to ensure that you don’t starve to death and have the nutrients you need to live (that is, ‘homeostatic’ feeding).

Two major types of hunger drive different feeding behaviors (Credit: Karl Tate, livescience.com)
The dopamine circuitry in the brain underlying hedonic feeding is somewhat similar to that involved in addictive drug-seeking behavior, and is very well understood. Alternatively, how dopamine regulates homeostatic feeding is much less well defined. There are 5 dopamine receptors (named D1R, D2R…D5R) expressed throughout the body and brain, each with distinct actions. This allows dopamine to have many different effects, depending on which receptor(s) is expressed in a given tissue/cell type. Of these, the D1R and D2R dopamine receptors have been shown to regulate food intake. These receptors are expressed in a major brain area important for maintaining physiological equilibrium within the body (that is, homeostasis), the hypothalamus. Keep that in mind as we move through this research paper.
To investigate how dopamine signaling alters whole-body metabolism and food intake, the authors infused bromocriptine, a drug that powerfully binds and activates D2R signaling, into the brain of rats. When they did this, rats receiving the drug gained significantly less weight over the following two weeks (see Figure 1). To see how this influences peripheral metabolism, the authors examined brown adipose tissue (BAT), which plays a critically important role in non-shivering thermogenesis (i.e., keeping you warm independent of shivering) and maintaining resting energy expenditure.

Figure 1: Enhancing D2R-mediated dopamine signaling in the brain (via bromocriptine infusions) reduces weight gain and influences brown adipose tissue (BAT) protein levels. This effect is driven largely by the sympathetic nervous system, as blocking beta-3 receptors blocks the effect of bromocriptine. (open circles = no bromocriptine infusion; green closed circles = bromocriptine infusion; grey closed circles = bromocriptine + beta-3 blocker infusion) (Credit: Folgueira et al., 2019).
In BAT, bromocriptine treatment caused the up-regulation of several proteins associated with metabolic activation (e.g., UCP1, FGF21, PRDM16). Functionally, this was associated with an increase in the temperature of this brown fat (inter-scapular BAT), indicating energy utilization was increased in response to bromocriptine treatment in the brain. How could a signal from the brain make it down to brown fat to control energy balance? A primary candidate is a branch of the autonomic nervous system (ANS), the sympathetic nervous system (SNS). This system controls ‘automatic’ functions in your body that are not typically under your control (like pupil diameter, gut motility, sweat glands…), including brown fat heat production. When the researchers treated rats with a beta-3 receptor blocker (which blocks SNS function on brown fat), the rats no longer showed changes in metabolism and body weight when administered bromocriptine (see Figure 1). This suggests that the SNS relays the signal from the brain to brown fat to mediate these effects.

Figure 2: The lateral hypothalamus/zona incerta is the primary brain area regulating systemic responses to bromocriptine (BC) treatment. Infusion of bromocriptine into the LH/ZI of rats had the same effect as brain-wide administration (Credit: Folgueira et al., 2019).
This answers how the signal makes it to the body from the brain, but does not let us know what brain region initiates or controls this (that is, where is the signal generated?). The researchers knew that the hypothalamus is a major area regulating homeostatic feeding, and therefore tested injecting bromocriptine in different hypothalamic areas to see if they could repeat the effect of ‘whole brain’ injections. After testing several areas, they demonstrated that bromocriptine injected into the lateral hypothalamus bordering the zona incerta had similar effects to that of brain-wide injections (see Figure 2).
Using a variety of techniques, they identified a specific cell type in this area (GABA-expressing) that seemed to be mediating these effects. To test this explicitly, they used a virus to express a designer receptor exclusively activated by designer drugs (DREADDs) in these neurons. This way, they could activate these cells with a simple injection of an inert compound (called CNO). When they did this, they observed the same effects as bromocriptine injections in to the lateral hypothalamus/zona incerta (see Figure 3). Additionally, when they used short hairpin RNAs to knockdown D2R, bromocriptine injections into this area no longer had any effect, demonstrating that GABA-expressing cells in this hypothalamic area mediate the effects of dopamine on body weight and metabolism via the D2-receptor!

Figure 3: DREADD-mediated activation of GABA-expressing neurons in the lateral hypothalamus/zona incerta repeat the effects seen with bromocriptine treatment. This suggests that GABA neurons in this hypothalamic area dictate the effect of dopamine signaling on whole-body metabolism and body weight (Credit: Folgueira et al., 2019).
The authors then spent a significant amount of time investigating what is happening in these GABA-expressing cells in the hypothalamus upon dopamine D2R signaling. They worked out a complicated molecular cascade that gets activated in response to dopamine, which mediates the downstream effects on body weight and brown fat heat production (involving PKA, rpS6, PDE3B). I think if I spent too much time on this, we’d get too lost in the weeds and no one would keep reading. If you’re interested in these details, please read the paper using the link at the beginning of this post!
Additionally, they uncovered that these D2R positive neurons actually act through their modulation of hypocretin/orexin neuron signaling. If you’ve been following the journal club for a while, you should be familiar with this cell type within the hypothalamus (it is my favorite!). When the authors used mice lacking hypocretin/orexin (genetic knockouts), bromocriptine no longer had an effect on metabolism and body weight! Additionally, when they activated GABA neurons using DREADD technology (as described above) along with a drug that inhibits hypocretin/orexin signaling, they no longer observed reductions in body weight or increases in BAT temperature! This strongly suggests that GABA neurons expressing D2R regulate whole body metabolism through their actions on hypocretin/orexin neurons.
All of this is important mechanistic work to understand circuitry underlying homeostatic hunger and energy balance. Following these extensive studies, the researchers took a retrospective approach to examine how another drug that binds the D2R, cabergoline, influences body weight in humans. This drug is not usually prescribed for obesity, but is given to combat a relatively common condition known as hyperprolactinemia as a result of tumors of the pituitary gland. They took data from a group of patients that had been given cabergoline for one year, and assessed body weight changes after 3 months and 12 months. They observed that patients treated with cabergoline experienced little to no side-effects and (on average) lost significant amounts of weight 3 months following starting treatment (see Figure 4). This effect persisted, to a degree, for a year following the start of treatment. They additionally demonstrated that patients had higher resting energy expenditure (similar to the BAT thermogenesis measures in rodents) than before they started treatment. Together , these data suggest that D2R signaling in the hypothalamus promotes weight loss by increasing resting energy expenditure through SNS innervation of brown adipose tissue.

Figure 4: Humans treated with a dopamine D2R agonist, cabergoline, lost significant amounts of weight 3 months after treatment started. Above, you can see the data stratified to show per-patient responses. (Credit: Folgueira et al., 2019).
This is a huge study that is promising as it provides complementary evidence for dopamine signaling in the hypothalamus regulating body weight from rats, mice, and humans. Importantly, the findings they observed in patients were using a drug already approved for human use (cabergoline), suggesting that it may be a relatively safe treatment to add to current standards of care for obesity and associated diseases. I think this study is a great example of how science should be done. The authors worked out an intricate mechanism, answering a key question in basic biology, and then confirmed their findings in a clinical setting using a retrospective human sample. I am excited to see how this work translates into clinical practice! Now, what do you think? Let me know if in the comment section below, and as always…stay curious!!

CD24 signalling through macrophage Siglec-10 is a target for cancer immunotherapy
Welcome to our Monthly Journal Club! Each month I post a paper or two that I have read and find interesting. I use this as a forum for open discussion about the paper in question. Anyone can participate in the journal club, and provide comments/critiques on the paper by leaving a comment below. I picked this month’s paper because it describes a potentially powerful new target to treat a variety of cancers using the immune system (immunotherapy). Also, I am (in part) a cancer researcher working on brain-immune interactions. Therefore, I found this paper to be very relevant to my work. The paper we are discussing is titled “CD24 signalling through macrophage Siglec-10 is a target for cancer immunotherapy” by Irving Weissman & colleagues at Stanford University.
Cancer is a complex and heterogenous disease. How can we hope to tackle this devastating illness to save lives? The classic approach of surgery followed by chemo/radiotherapy treatment is dangerous, not very effective, and can leave lasting damage that persists for the patient’s entire life. In recent years, a new strategy which harnesses the power of the immune system (immunotherapy) has gained substantial traction as a novel approach for eliminating cancer. The immune system is finely tuned to identify and kill foreign invaders (e.g., bacteria, viruses) and malignant or damaged cells (e.g., cancer cells). To do this effectively, the immune system must be able to identify ‘self’ vs ‘non-self’ in order to keep our healthy cells and tissues safe (i.e., autoimmunity). One way in which the immune system is regulated is through interactions between proteins expressed by target cells and those expressed by cells of the immune system (both lymphoid and myeloid cells). Some of these proteins enhance the immune response (e.g., MHC-II, CD28), while others drastically dampen immune activity (i.e., they are ‘don’t eat me’ signals, like PD-L1).

Cancer immunotherapy works by blocking ‘don’t eat me signals’ expressed by tumor cells. These signals (e.g., PD-L1) normally act to suppress adaptive immune responses, allowing cancer cells to escape destruction. If we block these signals, the immune system is no longer suppressed, and can recognize and kill the tumor.
Tumor cells take advantage of these interactions to trick the immune system into leaving them alone, allowing them to grow and proliferate without being targeted for destruction. Irving Weissman and his colleagues were interested in identifying exactly which proteins are involved in tumor cell-immune system interactions allowing them to ‘turn off’ the immune response. From previous work on immune regulation, they knew that a protein called CD24 interacts with cells of the immune system (macrophages) through a receptor called Siglec-10 to dampen the inflammatory response. Activation of siglec-10 on macrophages by CD24 prevents the macrophage from engulfing (phagocytosis) and destroying any cell expressing CD24. Interestingly, many types of cancer express very high levels of CD24, especially ovarian cancer. Building on this information, the authors aimed to investigate the role CD24/siglec-10 signaling plays in helping cancer cells evade immune destruction.

Figure 1: CD24 is widely expressed in many forms of cancer (in panel a), and its expression in ovarian and breast cancer is associated with poor prognoses (panels b and c). Additionally, CD24 is primarily expressed by tumor cells while Siglec-10, the binding partner for CD24, is primarily expressed by macrophages in the tumor microenvironment.
Starting with publicly available RNA expression datasets, the authors found that nearly all tumor types they looked at expressed high amounts of CD24, and many types expressed it in higher amounts than other well described immunotherapy targets like PD-L1 and CD47 (see Figure 1 above). Additionally, tumor-associated macrophages (TAMs) express significant amounts of the binding partner (ligand) of CD24, siglec-10, and expression of CD24 is negatively associated with patient survival in ovarian and breast cancer.
To test the mechanisms that may explain these findings, the researchers started to examine how cancer cells and TAMs interact in a dish (in vitro). By using a pH sensor that glows red (pHrodo Red) and human breast cancer cells that glow green (MCF-7 GFP). When macrophages eat a tumor cell, the pH drastically changes, causing the pH sensor to glow red (see Figure 2). Using these tools, the researchers are able to quantify how many tumor cells macrophages normally eat and how many they eat when CD24 signaling is altered. Following this process over 36 h demonstrated that cells with mutated CD24 (delta-CD24) were eaten up by macrophages (i.e., destroyed) much more than cancer cells with intake CD24 signaling. Simultaneous blockade of another ‘don’t eat me’ signal (CD47) augmented this process, suggesting that these signals do not serve redundant functions and can work in tandem to achieve maximal cancer destruction. In a reciprocal experiment, knocking out (or blocking with antibodies) the binding partner of CD24 (siglec-10) also resulted in macrophages eating up many more cancer cells. This cemented the notion that CD24-siglec-10 signaling powerfully protects cancer cells from being destroyed by the immune system.

Figure 2: CD24 blockade (alone or in combo with CD47 blockade) significantly increases cancer cell destruction by macrophages. Similarly, knocking out the binding partner for CD24 (siglec-10) had similar effects. Note the number of red puncta in panel i, these indicate cancer cells that have been eaten (destroyed) by macrophages. There is much more red after CD24 is blocked.
Expanding on these findings, the researchers started to look at other types of cancer, and whether manipulating CD24 could influence the destruction of cell lines from breast cancer (MCF-7), pancreatic cancer (APL1 and Panc1), or . Indeed, using a flow-cytometry approach, they were able to demonstrate that CD24 blockade, alone or in combination with CD47 blockade, drastically increased cancer cell destruction by macrophages (see Figure 3 below). Importantly, the effect was not evident in a cell line that does not normally express CD24 (U-87 MG). Moving away from cell lines, they tested whether CD24 blockade could influence the ability of macrophages to destroy primary ovarian cancer cells (that is, cells taken directly from a patient). In this case, CD24 blockade increased cancer destruction, with dual CD24 and 47 blockade being the most effective!
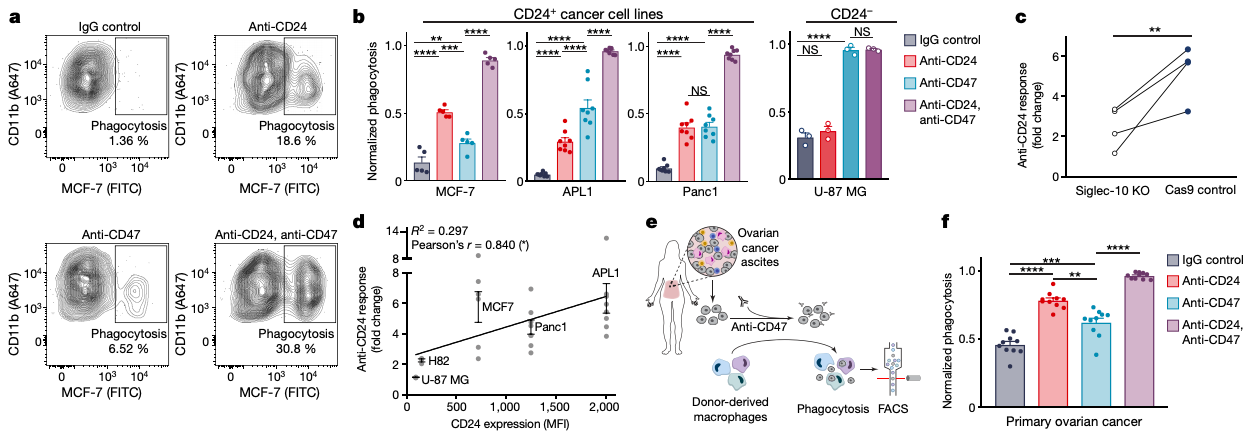
Figure 3: Blockade of tumor cell CD24 increases tumor cell destruction (phagocytosis) by preventing inhibitory siglec-10 signaling on macrophages. This effect is evident in models of breast, pancreatic, and small-cell lung cancer, but not in cells that naturally do not express CD24 (U-87 MG). Additionally, blockade of CD24 and CD47 drastically increases primary cancer cell destruction by patient derived macrophages in a patient with ovarian cancer.
To move their mostly in vitro work into a more realistic in vivo model, they turned to using a laboratory mouse model of breast cancer where the cancer cells have normal (wildtype; WT) or mutated (delta-CD24) levels of CD24 expression (see Figure 4 below). By tagging the tumor cells with a gene encoding firefly luciferase (MCF-7-luc), they can track the distribution of the cancer in a living organism non-invasively using an extremely light sensitive camera. When luciferin is injected into the mice, luciferase catalyzes a reaction that results in visible light being emitted from any cell expressing luciferase (i.e., the cancer cells). This is called bioluminescence, and it can be visualized and quantified using a specialized camera.
Mice with mutated versions (that is, non-functional) of CD24 showed much less tumor growth than mice with normal expression of CD24. Additionally, depleting tumor-associated macrophages (TAMs), which eat up cancer cells, enhanced tumor growth in mice with mutated CD24. This suggests that manipulation of CD24 in a living organism (mouse) powerfully influence cancer progression, and this is largely driven by cancer cell-macrophage interactions (CD24-siglec-10). Mice that had non-functional CD24 mutations lived significantly longer than mice with normal amounts of this protein (see Fig. 4c below). When mice with functional CD24 on cancer cells were administered an antibody that blocked CD24 signaling (anti-CD24), this also significantly reduced tumor growth, although to a lesser degree than genetic mutation of CD24. This is important because it demonstrates that a single antibody treatment may be viable for treating a variety of cancers by targeting a common interaction between cancer cells and tumor associated macrophages.

Figure 4: Cancer cells with mutated (non-functional) CD24 form smaller tumors which are less lethal than those formed by cells with functional CD24. Additionally, blocking CD24 with anti-CD24 antibodies resulted in smaller tumors similar to what was seen with genetic inactivation of CD24.
Together, the data described in this paper suggest a new target for immunotherapy-mediated cancer destruction. The promise of this approach, in comparison to other immunotherapy targets, is that many different forms of cancer express high levels of CD24 (compared to popular targets like CD47 or PD-L1), it has a known binding partner (siglec-10), and anti-CD24 antibodies already exist. Additionally, CD24 isn’t expressed highly on many other types of cells that might cause significant side effects (e.g., red blood cells), so blocking this target may not have as significant side effects as other treatments. As with all of these immunotherapy treatments, significant more work is to be done to make sure that when we mess with one piece of a complex circuit, we don’t end up short circuiting the whole thing. Thanks for joining this month, leave a comment below on what you think…and as always, stay curious!

Figure 5: Mechanism of cancer cell destruction by tumor associated macrophage through blockade of CD24 - Siglec-10 signaling.
Transneuronal Propagation of Pathologic alpha-Synuclein from the Gut to the Brain Models Parkinson's Disease
Welcome to our Monthly Journal Club! Each month I post a paper or two that I have read and find interesting. I use this as a forum for open discussion about the paper in question. Anyone can participate in the journal club, and provide comments/critiques on the paper by leaving a comment below. I picked this month’s paper because it demonstrates that toxic protein aggregates can spread from the gut to the brain, causing Parkinson’s disease-like symptoms. This is a major step forward for the ‘gut-brain’ hypothesis of Parkinson’s Disease, a really interesting idea that has gained a lot of traction (and hype) recently. This idea was first put forth by Heiko and Eva Braak, and is also referred to as the Braak Hypothesis. The paper we are discussing was published in Neuron, and is titled “Transneuronal propagation of pathologic alpha-synuclein from the gut to the brain models Parkinson’s Disease” by Han Seok Ko & colleagues at Johns Hopkins University in Baltimore.
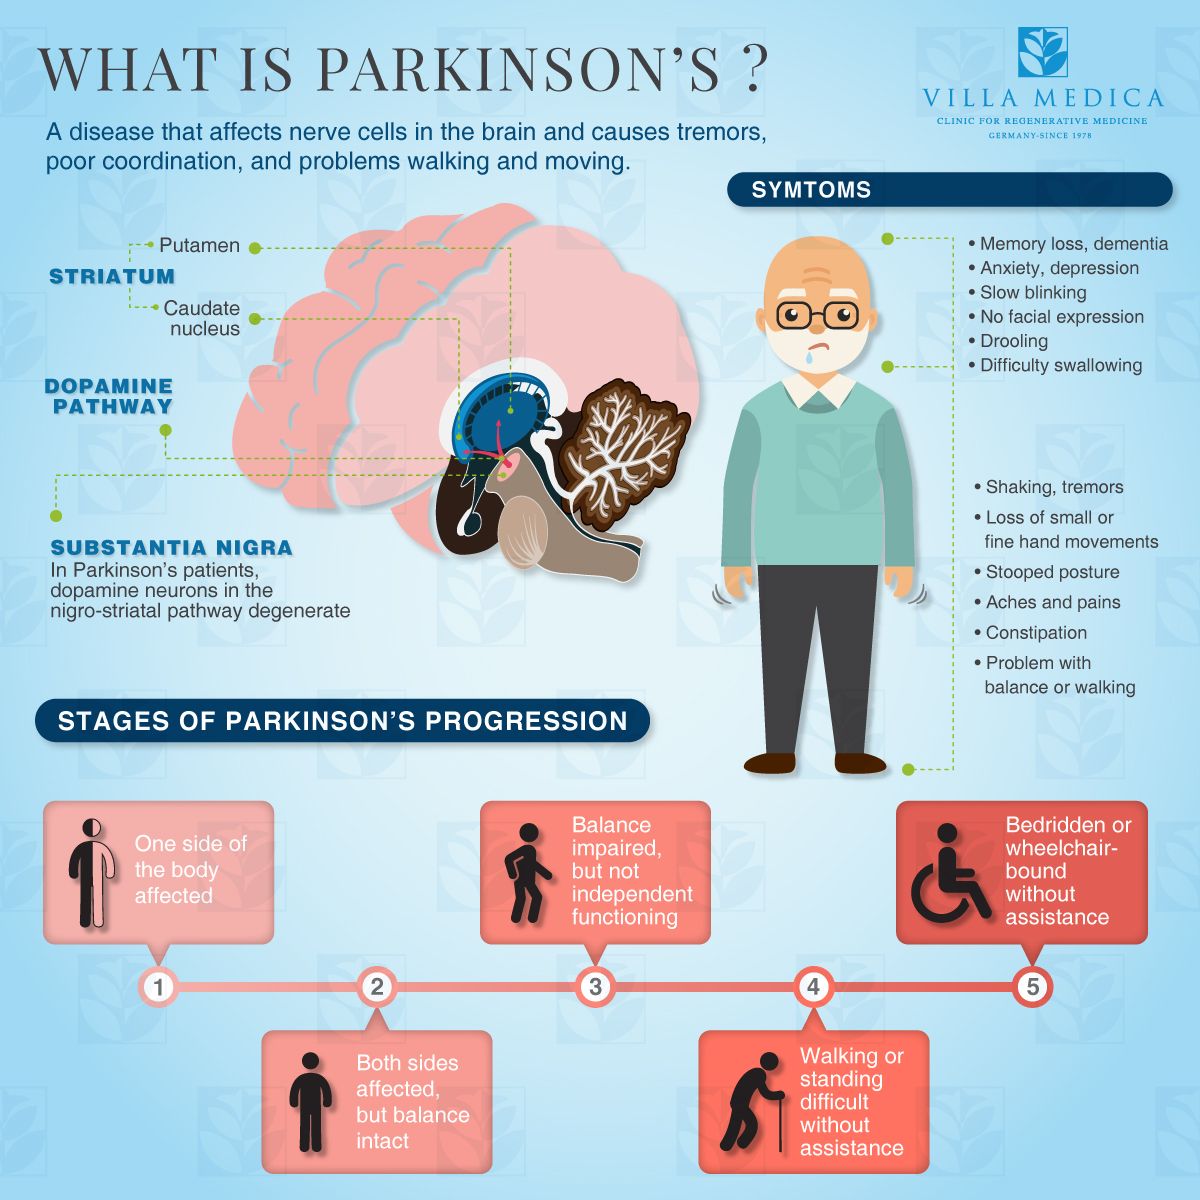
An overview of Parkinson’s Disease. (Credit: Villa Medica)
Parkinson’s Disease is a neurodegenerative disorder caused by destruction of dopamine-producing cells in the substantia nigra in the midbrain. The exact causes of this cell death are unclear, and several hypotheses have been tested and rejected time and time again (e.g., the autoimmune hypothesis). Parkinson’s Disease is part of a class of neurodegenerative diseases called ‘synucleinopathies’, which are characterized by aberrant aggregations of a protein called alpha-synuclein. Aggregates of this protein can be viewed in brain sections (using a microscope) and are termed ‘Lewy Bodies’. They spread throughout the brain in a characteristic pattern during the course of Parkinson’s disease, typically starting in the dorsal motor nucleus of the vagus (DMV) before reaching the midbrain. This suggests that problems may begin in downstream areas that relay signals through the DMV…like the gut. Whether alpha-synclein can travel from the gut to the brain has been a challenging question to answer. Using a clever approach, Ko & colleagues demonstrated that this is indeed possible when the protein is artificially induced into the stomach/small intestine area (see the figure below). A thing to keep in mind, however, is that this paper demonstrates that such a mechanism can exist, it doesn’t provide evidence that it does exist or ‘causes’ Parkinson’s disease in humans.
To cut a very long story short, others have shown that a pathogenic variant of alpha-synuclein can be made in a dish (in vitro), where they are termed ‘pre-formed fibrils; PFFs’. These fibrils can ‘jump’ from neuron-to-neuron in a living organism (in vivo) and cause symptoms remarkably similar to those found in sporadic Parkinson’s disease. The authors took advantage of these PFFs to test their hypothesis by injecting them into various parts of the gastrointestinal system, and seeing if they would ‘jump’ along nerve cells up to the brain, where they could promote the development of Parkinson’s disease.

Pre-formed Fibrils (PFFs) injected into the pyloric stomach (PS) or upper duodenum (UD) promote synucleinopathy in multiple brain regions. The pathology spreads in a stereotypical pattern resembling Parkinson’s disease progression. Alpha-synuclein aggregates are shown as ‘brown spots’ in the photomicrographs above. Note that mice receiving a control injection (PBS) do not show any aggregates even at 10 months post-injection (Credit: Kim et al., 2019).
After injecting PFFs into multiple areas around the gut (pylorus of the stomach) and upper small intestine (duodenum), they looked at the brains for signs of pathology at multiple time points (1, 3, 7, and 10 months). They observed aggregates of alpha-synuclein in multiple nuclei, showing a characteristic distribution pattern starting in the DMV and spreading all the way to the prefrontal cortex by 7-10 months post-injection. This is an exciting finding, as it demonstrates that pathological alpha-synuclein originating in the gut can promote Lewy body formation in the brain in as little as 1 month. The authors then asked whether these histological findings actually caused destruction of dopaminergic neurons in the midbrain, the neurodegenerative mechanism of Parkinson’s disease (see the figure below).

Injection of PFFs into the gut (pyloric stomach/duodenum) promotes the destruction of dopaminergic neurons in the mouse midbrain. Note the difference between the 7 and 10 month time-points between mice injected with PBS (control) or PFFs. Both dopaminergic (TH) and total (Nissl) neuron counts were drastically reduced by 7 months post-injection. Levels of TH, the dopamine transporter (DAT), and dopamine itself were significantly reduced by 7-10 months post-injection (Credit: Ko et al., 2019).
To examine dopamine-producing neurons in the midbrain, they stained brain sections using an antibody against tyrosine hydroxylase (TH), the rate-limiting enzyme in the dopamine production pathway. This protein is highly produced in dopamine producing neurons…so it can be used as a highly abundant and specific marker for these neurons. They observed drastic reductions in TH+ neurons (i.e., those that produce dopamine) in the midbrain 7-10 months following PFF injections into the gut! In addition to counting the number of TH+ neurons, the authors verified their data using a pan-neuronal marker (Nissl), another marker for dopaminergic neurons (the dopamine transporter (DAT)), and dopamine itself! All of these markers were reduced in mice that were administered intra-gastric PFFs.

Trucal vagotomy (TV) or knockout of endogenous alpha-synuclein (Snca-/-) prevents the destruction of midbrian dopamine neurons characteristic of Parkinson’s disease! Note that alpha-synuclein aggregates (p-alpha-Syn; green color) were only observed in mice with intact vagal nerves and with normal copies of the Snca gene (Credit: Ko et al., 2019).
The next logical step is to see whether blocking transport of PFFs into the brain, or knockout of alpha-synuclein altogether, can prevent these pathologies from developing. To block the transport of these toxic proteins, the authors cut a portion of the vagus nerve (truncal vagotomy; TV), the neural superhighway connecting the body to the brain. When they repeated their experiments in mice that underwent the TV procedure, they no longer showed signs of Parkinson’s disease (Lewy bodies or loss of dopaminergic neurons)! This strongly suggests that PFFs travel via the vagus nerve (across multiple synapses!) from the gut to the brain, where they promote the destruction of dopamine-producing neurons (see the figure above). Another hypothesis to the ‘jumping’ idea mentioned above is that PFFs seeded in the gut promote the misfolding of normal alpha-synuclein, which then propagates to the brain. If this is the case, then knocking out normal alpha-synuclein (the gene is called Snca) would also prevent the development of Parkinson’s disease, as the toxic PFFs wouldn’t be able to promote the misfolding of alpha-synuclein which cause disease.
When the authors repeated their experiment in mice lacking the gene for alpha-synuclein (Snca-/-), they observed no destruction of midbrain dopamine neurons, just like in mice whose vagus nerves had been cut! This additional experiment supports the idea that PFFs can cause a cascading spread of misfolded alpha-synuclein which ultimately reaches the brain to cause disease!
The authors went onto test whether injection of PFFs into the gut causes Parkinson’s disease-like symptoms (in addition to the brain pathology), and whether TV or knocking out Snca could prevent these behavioral problems. Using a battery of behavioral tests, they demonstrated that gut-injections of PFF cause mice to develop balance problems, memory impairments, reduced strength, olfactory (smell) deficits, and impaired cognition. Importantly, they observed that TV or Snca ablation rescued these behavioral problems that closely resemble Parkinson’s disease (data not shown here; see the primary paper linked in the first paragraph).

Summary of the study’s findings. In a ‘normal’ mouse, injection of pre-formed fibrils into the gut causes Parkinson’s disease-like symptoms and pathology. This can be prevented by cutting the vagus nerve or by knocking out the gene for alpha-synuclein (Snca-/-) (Credit: Ko et al., 2019).
This study provides exciting support for the Braak hypothesis, and suggests that pathogenic alpha-synuclein in the gut can cause the misfolding of the endogenous protein, which then propagates to the brain via the vagus nerve to cause Parkinson’s disease-like symptoms and pathology. Whether this phenomenon occurs in humans is still an open question. If it does, a whole new class of therapeutics for Parkinson’s disease targeting the gut/nerve interface could be around the corner! I can’t wait to see what comes of this research going forward! So now its your turn to tell me what you think by leaving a comment below or by tweeting at me on twitter! See you next time guys…and as always…stay curious!
Progenitors from the central nervous system drive neurogenesis in cancer
Welcome to our Monthly Journal Club! Each month I post a paper or two that I have read and find interesting. I use this as a forum for open discussion about the paper in question. Anyone can participate in the journal club, and provide comments/critiques on the paper by leaving a comment below. I picked this month’s paper because if these findings are true, it is a real paradigm shifting piece of work, substantially challenging what we know about cancer (and specifically prostate cancer), the nervous system, and cell migration in general. Also, this research falls squarely into my wheelhouse, as I too work on how the nervous system and cancer communicate! It was published in Nature, and is titled “Progenitors from the central nervous system drive neurogenesis in cancer” by Claire Magnon & colleagues at the François Jacob Institute of Biology in France.

Tumors interact with their local environment and by extension, the whole organism. These interactions can result in deleterious outcomes for patients, like tumor progression, metabolic problems, anorexia, inflammation, and sleep/circadian disruption. Magnon and colleagues provide evidence that in addition to these established pathways, neural progenitor cells leave the brain and migrate to the tumor (in a model of prostate cancer), promoting cancer growth and progression. (credit: Walker II & Borniger, 2019).
The primary claim in this paper is extraordinary, and I quote it here verbatim: “Here, we reveal a process of tumour-associated neo-neurogenesis in which neural progenitors leave the subventricular zone (SVZ) and reach—through the blood— the primary tumour or metastatic tissues, in which they can differentiate into new adrenergic neurons that are known to support the early stages of the development of cancer”.

Neural Progenitor Cells (DCX+, green), Astrocytes (GFAP+, blue), and blood vessels (CD31+, red) in the mouse olfactory bulb. These cells are born in the subventricular zone, and then migrate to the olfactory bulb along the rostral migratory stream to integrate into olfactory (smell) circuits. (Credit: CC; Oleg Tsupykov).
This raises many many questions, like…how do newly born neural cells know how to get all the way from the brain to a tumor so far away? How do these cells make it past the blood brain barrier (BBB), and even if they do make it this far….how do we know that the cells that make it to the prostate are the same ones that left the brain? There are, after all, neurons in the peripheral nervous system (PNS) that could be infiltrating the tumor to cause these effects. The idea that newly born neurons can leave the nervous system is pretty wild on its own…but the claim that they not only leave, but migrate all the way to a distant tumor where they promote its growth is amazing….if true! Below, I’ll go through the primary figures in this paper one by one and explain what the authors are showing. If I feel like something is missing, or there could have been additional work done, I will say so. So far…it feels like this paper has not gotten the attention it deserves…probably because neuroscientists rarely talk to cancer biologists!
The authors started by looking at prostate tumor samples to see if they indeed contain neural progenitor cells. To label these types of cells specifically, they applied antibodies against doublecortin (DCX) which were tagged with a green fluorescent molecule. This way, all the DCX-expressing cells (i.e., neural progenitor cells) appeared green under a microscope. As one marker is not enough to convince the editors at Nature, they showed that these cells also express other markers of immature neurons (PSA-NCAM, internexin), but not markers of mature neurons (neurofilament-heavy (NF-H)) or epithelial cells (Pancytokeratin (PanCK)).

Figure 1: Neural progenitors (DCX+, PSA-NCAM+, INA+) are found in prostate tumor samples and they provide a prognostic indicator of cancer recurrence/survival. These neural progenitors do not express markers of epithelial cells or mature neurons, and increased amounts of these cells within the tumor is associated with high-risk tumors compared to low-risk and benign (BPH) samples. Additionally, with each part of the prostate that the tumor invades, there is a concomitant increase in neural progenitor cells. (Credit: Mauffrey et al., 2019)
After showing that these ‘central progenitor’ cells can be found in human tumors, the researchers moved to working in a mouse model of pancreatic cancer to more finely understand how these cells get to the tumor and what they do when they get there. First, though, I want to highlight that the marker that they use (DCX) to distinguish newly-born neurons is also expressed in the peripheral nervous system, which raises concerns that their interpretation of cells traveling from the brain to the tumor might be incorrect. Using a triple-transgenic strategy, they engineered mice to express enhanced yellow fluorescent protein (eYFP) in cells that make a human version of DCX (DCX-eYFP mice). This way, all DCX-expressing cells show up as yellow under the microscope (see Fig. 2 below). In addition to these genetic manipulations, mice were engineered to express myc, a proto-oncogene that is highly expressed in most cancers, specifically in the prostate, causing mice to develop prostate tumors similar to those found in humans.
When they analyzed DCX-eYFP cells within the brain and prostate of mice with and without tumors, they found eYFP+ cells in known brain locations, but only in the prostates of mice with prostate cancer. This suggests, that these cells are somehow recruited to the prostate during tumor formation, but not during normal functioning of the pancreas. A benefit to having cells that are labeled yellow is that we can easily run them through something called a fluorescence activated cell sorter (FACS; flow cytometer). This lets us label them with additional colors to see what other proteins they express, and quantify them with single-cell resolution. Using this technique, the researchers demonstrated that DCX-eYFP neural progenitors in the prostate do not express mature cell lineage markers (i.e., they are lin-negative), boosting the idea that these cells truly are progenitor cells (see Fig. 2b).

Figure 2: In a mouse model of prostate cancer (Hi-MYC) where neural progenitor cells are labeled yellow (DCX-eYFP), these cells are found throughout the prostate, similar to DCX expression in human tumors. Additionally, these prostate DCX+ cells express markers of neural progenitors (e.g., nestin, CD24) without markers of stem cells (e.g., SOX2). (Credit: Mauffrey et al., 2019)
A small gripe I have with the above figure has to do with the statistics used. For panel 2b, the authors state the data were analyzed using a one-sided Student’s t-test, which is a test that should be used for simple comparisons between two groups when there is strong evidence to suggest the outcome you are looking for is true. In biology, one-sided tests are rarely used, and the use of one here suggests that the authors were rather liberal when assigning significance…even though to the eye, it seems like the data would be significant with a two-tailed test, or a 2-way ANOVA with a more conservative post-hoc test (e.g., Tukey’s HSD).
Sorry for that tangent…moving back onto the paper, the authors provided evidence that DCX+ neural progenitors in the tumor differ in a few different ways from progenitors found in the brain. Specifically, they did not express markers of stem cells (e.g., SOX2) or markers of activated neural stem cells (e.g., GFAP, GLAST, CD133…). Instead, they expressed markers of neural progenitors (e.g., nestin, CD24). This can be seen in Fig. 2d, where samples from the brain (OB, SVZ) are compared to prostate tumor samples at 16 weeks or 52 weeks following cancer-induction. Strangely, in the text the authors describe that these cells showed neuron-differentiation and neuron-projection signatures, and say these data can be found in Figure 2f…but this panel does not exist.

Figure 3: Neural progenitors in the prostate differentiate into adrenergic neurons during tumor development. (Credit: Mauffrey et al., 2019)
After showing that DCX+ neural progenitors are present in their mouse model of prostate cancer (Hi-MYC), they went on to see if these cells ‘commit’ to a lineage and become a certain type of neuron. Specifically, they asked whether the cells would differentiate into neurons that produce the neurotransmitter norepinephrine (noradrenaline), which are called ‘adrenergic neurons’. This is important because adrenergic neurons can have wide-ranging effects on tumor growth, cancer progression, and metastasis. In the nervous system, DCX+ cells that migrate to the olfactory bulb (OB) usually ‘commit’ to the interneuron cell fate, allowing them to integrate into the circuits that process smell information. In Fig. 3, we can see that when cells were extracted from the brain (OB) or when cells were collected from the prostate tumor and grown in a dish (in vitro), they were able to differentiate into mature neurons (NF-H+), suggesting that these cells can commit to a terminal neural fate. Specifically, when looking in the organism (in vivo), Lin- eYFP+ neural progenitors were present in the tumor (blue color in Fig. 3 f,g,h), they fluctuated in amount during the course of tumor growth, and sent projections (axons) throughout the tumor tissue (Fig. 3 d,e). When co-labeled with an antibody against tyrosine hydroxylase (TH; a key enzyme in the norepinephrine synthesis pathway), they observed that DCX-eYFP+ cells also expressed TH, suggesting that they are indeed adrenergic neurons.

Figure 4: Neural progenitors in the brain (SVZ) migrate through the blood towards the prostate tumor in the Hi-MYC mouse model of pancreatic cancer. Note: red (TdTomato) cells that originated in the brain’s SVZ could be found in the tumor throughout tumor development! Credit: Mauffrey et al., 2019).
So now we know that there are neural progenitors that colonize the tumor and can differentiate into adrenergic neurons (TH+). The question then becomes…where do these cells come from and how do they know how to get all the way to the tumor? They started by looking in the brain at different neural progenitor cells, and how their numbers change over time. They noted that a sub-population (green in Fig. 4) of Lin-eYFP+ progenitors changed in the SVZ during tumor growth, adding that this may be evidence of some of these cells leaving the area or the brain altogether (to putatively migrate to the tumor). To test this, they injected a lentiviral vector encoding the fluorescent protein TdTomato (red) into the SVZ to track where the cells go (as cells coming from that region will be labeled red no matter where they go in the body). The showed that these tagged neural progenitor cells could be found in the prostate tumor environment by 8, 12, and 16 weeks following tumor induction, providing evidence that they did indeed make the migration out of the brain (Fig. 4 f,g,h)! Additionally, by labeling the vasculature (CD31+) around the SVZ, they showed that in mice with tumors, the blood brain barrier (BBB) was disrupted, suggesting that the neural progenitors are able to leave the brain because the BBB is not functioning as usual.
One note I want to make is that the lentivirus approach that they used is not ‘cell-type specific’, and cells besides their target population (DCX-eYFP+) were definitely labeled. Additionally, since the lentivirus can infect any cells in the area, and it can actually travel in the blood stream and label cells outside the brain…this represents a potentially significant caveat.

Figure 5: DCX+ progenitor cells regulate tumor development in mice. Mice lacking DCX+ cells grew tumors that were much less aggressive and invasive. (Credit: Mauffrey et al., 2019).
Finally, a major unanswered question was the ‘so-what?’ question, that is, do these cells actually do anything in the tumor micro-environment, or are they just sitting there as bystander cells. To test this, the authors used another transgenic strategy to express the diphtheria toxin receptor (DTR) on DCX+ progenitor cells. This allowed them to specifically eliminate DCX+ cells, letting them test whether they do indeed influence how prostate cancer develops.
They further used a new cancer model (PC3-Luc), where tumor cells are implanted in a recipient mouse. These cells were additionally engineered to express firefly luciferase (Luc). This allows researchers to ‘see’ where the tumor cells are in each mouse non-invasively, simply by injecting luciferin and measuring the light that is given off using a specialized camera (measured in photons). Using these approaches, they demonstrated that tumors in mice lacking neural progenitor cells (DCX+ ablated) caused fewer lesions and prevented the engraftment of transplanted tumor tissue. This suggests that DCX+ progenitor cells are critical for the early stages of tumor development! More striking is the finding that selectively eliminating DCX+ cells in the SVZ significantly inhibited tumor development, adding credence to the idea that these cells really do migrate from the brain to the prostate to elicit their effects. In the opposite experiment (where they transplanted DCX+ cells into mice with established tumors), they observed enhanced tumor growth (Fig. 5 d,e)!
Together, this study has a few problems that may detract from it’s primary finding. However, if additional research demonstrates that this phenomenon is real, it could be a huge game changer for both neuroscience and cancer! If depleting neural progenitors becomes a viable option for tumor suppression, this would be a completely new avenue for the treatment of prostate cancer, and potential other malignancies as well! One huge question that remains to be answered is “what is the signal from the tumor that causes progenitor cells to migrate?”. Figuring out the answer to this will be of paramount importance in developing tangible and realistic therapeutics.
Sorry for the super long post, but I just got really into this paper! Leave a comment below and join the discussion! For the latest updates, as always, follow me on twitter @jborniger. ‘Till next time, stay curious!
Exercise enhances motor skill learning by neurotransmitter switching in the adult midbrain
Welcome to our Monthly Journal Club! Each month I post a paper or two that I have read and find interesting. I use this as a forum for open discussion about the paper in question. Anyone can participate in the journal club, and provide comments/critiques on the paper by leaving a comment below. I picked this months paper because it adds additional evidence for a really cool and understudied type of neural plasticity: neurotransmitter switching. Also, this is the first preprint featured on this website, and therefore you must take the findings in this paper with a grain of salt as they have not been peer reviewed. I do love BioRxiv, because it is a great way of getting your ideas out there before the long publication process has been completed, and it is journal agnostic. Also…I have accepted an assistant professor position at Cold Spring Harbor Laboratory, where BioRxiv was started…so the fit for this month was perfect!
This month’s paper is “Exercise enhances motor skill learning by neurotransmitter switching in the adult midbrain” by Hui-quan Li and Nicholas Spitzer at the Kavli Institute for Brain and Mind located at the University of California - San Diego. On top of his great research program, Dr. Spitzer is undoubtedly the winner of the “Best Moustache in Neuroscience” award. I will provide a brief overview of the techniques/approaches used to make it more understandable to non-expert readers. If I can’t figure something out, I’ll just say so. Check out the video below for a quick summary of how neurotransmitter switching makes up a unique form of neural plasticity.
Hui-quan Li and Nicholas Spitzer were interested in how motor learning occurs, the process by which we become better and better at specific motor tasks via trial and error (e.g., using chopsticks, speaking fluently, and quick reflexes…). This obviously involves a form of neural plasticity, as our brains need to change in some way to strengthen the circuits that improve a behavior, while refining those that detract from it. Motor learning has been intensely studied in the realm of neuroplasticity, involving circuits in the cortex, basal ganglia, brainstem, cerebellum, and spinal cord. However, whether neurotransmitter switching contributes to this form of learning was unknown. Neurotransmitter switching is an under-appreciated form of plasticity, as in most high school and college textbooks, neurons are assigned a neurotransmitter (e.g., dopamine neuron) which sticks with them for life, making the concept of a plastic ‘switchable’ neurotransmitter repertoire foreign to most students. Today I’m going to try and make the case for neurotransmitter switching, using this beautiful study as a template!
The authors started by examining how the brain changes in response to a week of aerobic exercise (a running task, shown below). They trained mice to run on a wheel throughout the week, and then tested their motor coordination on a rotating rod (rotarod) and a balance beam. They demonstrated that after a week of training, mice that ran increased their speed on the running wheel, fell off the rotarod at higher speeds of rotation, and kept better balance on the balance beam than mice that didn’t run. This learning effect lasted for up to 2 weeks following training, suggesting that mice learned the motor behavior, but this ‘motor memory’ can be lost if it is not reinforced with more exercise.

One week of running training induces motor learning, an effect that lasts at least 2 weeks post-training. (Credit: Li & Spitzer, 2019)
So now that we have a strong motor learning experimental set up, we can begin to understand what is going on in the brain in response to the running training. To do this in an unbiased fashion, the authors used a technique called ‘cFos mapping’, where the brain is sectioned following training (or no training as control) and cells are labeled with antibodies against the immediate early gene cFos. This is a proxy of recent neural activity, and lets researchers look for cells in the brain that were activated immediately before the tissue was collected (Approx 30-90 minutes before). By using this method, they found that in response to running training, neurons in a brain structure called the pedunculopontine nucleus showed signs of increased activity (more cFos+ cells detected; see below).

Running induces neural activity (cFos labeling) in multiple brain regions, and most notably in the pedunculopontine nucleus (PPN). Here, we can see that in response to running, higher amounts of cFos are detected in the PPN (red = all neurons, green = cFos (active neurons)). (Credit: Li & Spitzer, 2019)
This is an interesting finding, but the authors still did not know what type of neurons were being activated by the running. This is important to know, as different neurons (even in the same brain area) can have opposing effects on behavior/learning. As there had been previous work done in this brain area, they labeled cells for some primary neurotransmitter types in the PPN: Acetylcholine and GABA.

Running induces a neurotransmitter switch from acetylcholine to GABA in the caudal pedunculopontine nucleus (cPPN). Above, we can see that the number of acetylcholine producing neurons (ChAT+) decreases in response to running, with a concomitant increase in GABA-production (GAD1+). (Credit: Li & Spitzer, 2019).
Indeed, they found these two types of neurons in the PPN. They observed that in response to running, the number of active acetylcholine-producing neurons (ChAT+ and cFos+) increased dramatically in the caudal region of the PPN. However, this was associated with a decrease in the amount of acetylcholine producing neurons in this area…how could that be? It turns out that these cells were not disappearing, but switching which neurotransmitter they predominantly make (from acetylcholine to GABA) in response to running!

Acetylcholine-expressing neurons in the caudal Pedunculopontine nucleus (cPPN) lose acetylcholine and gain GABA in response to 1 week of running training. (Credit: Li & Spitzer, 2019).
To investigate this more deeply, they used viruses that infect neurons (adeno-associated viruses (AAVs)) that carry transgenic DNA payloads (plasmid DNA; pDNA). This payload is inactive (i.e., it does not do anything by itself), but becomes active in the cell when a certain enzyme is present: Cre-recombinase. The researchers used mice that express this enzyme only in acetylcholine-producing neurons (also known as ChAT-IRES-Cre mice). By combining cre-dependent viruses with ChAT-Cre mice, they are able to express transgenes in a specific brain region in a ‘cell-type specific’ manner. They used this approach to make acetylcholine neurons in the cPPN express mRuby2, a very bright version of red fluorescent protein. This way, they can track how these neurons (which will always be red) change their neurotransmitter components in response to running. Using this technique, they demonstrated that a sizable proportion of neurons in this brain area switch their neurotransmitter of choice from acetylcholine to GABA in response to just a week of running!

Viral-mediated prevention of neurotransmitter switching (via upregulation of ChAT expression) prevents motor learning following a running task. (Credit: Li & Spitzer, 2019).
The authors went on to test what other brain regions these cells send projections to, which likely mediates their involvement in motor learning. They used beads that travel backwards along neuron projection axons (retrograde labeling) to label cells in the PPN that project to other brain areas involved in motor behavior/learning. They found that running reduced the number of ChAT+ (acetylcholine) terminals (where neurotransmitter is released) in multiple brain regions, including the ventral tegmental area, substantia nigra, and thalamus, key regions for motor learning.
Now the question moved onto whether this neurotransmitter switching was actually important for the motor learning. In simpler terms, this is the ‘so what?’ question. To test whether the loss of ChAT expression in the cPPN was important for motor learning (or was just a side-effect), they used ChAT-Cre mice as before, but injected a virus that promoted the cells to make a ton of acetylcholine, preventing them from making the switch to GABA (see above). When they did this, the mice no longer were able to display motor learning behavior, and they performed just as badly as non-trained mice on the rotarod and balance beam tests! This demonstrates that loss of acetylcholine expression in the PPN is important for this type of motor learning.

Prevention of the Acetylcholine/GABA switch during training prevents motor learning. Using a short-hairpin targeting GAD1 (shGAD1) to knock down it’s expression in ChAT+ neurons in the PPN, the authors demonstrate that without increased levels of GABA in response to running, the mice no longer learn this task. (Credit: Li & Spitzer, 2019)
What about the GABA, though? If loss of acetylcholine expression is necessary for learning, is gaining GABA also necessary? To test this, the authors again used a viral approach. Using ChAT-Cre mice to target only neurons expressing acetylcholine in the PPN, they injected a Cre-dependent short-hairpin RNA against a gene that is important in the synthesis of GABA (shGAD1). When they trained these and control mice (which were injected with ‘scrambled’ shRNA) on the running protocol, only mice with the scrambled construct (which doesn’t affect gene expression) that completed the motor learning task showed a major uptick in the number of GABA-expressing neurons (GAD1+). This suggested that their shRNA technique successfully knocked down GABA and prevented acetylcholine neurons from ‘switching’ in response to running. When these same mice had their motor learning tested on the rotarod and balance beam, those that had GABA knocked down in the PPN showed no signs of learning (see above panel (e) and (f)). Together, over expression of acetylcholine or knockdown of GABA in the cPPN prevented motor learning. This strongly indicates that neurotransmitter switching in the PPN plays a major role in motor learning. Aerobic physical exercise promotes the ability to acquire new motor skills, and it serves as a therapy for many motor disorders including Parkinson’s disease, coordination disorder, and autism. Until this study, how this worked at the neural level was poorly understood. These findings strongly implicate neurotransmitter switching as a form of neuroplasticity that underlies motor learning, and offers a potentially new target for treatment of a large variety of diseases.
That’s it for this post guys! Please share what you think in the comments below, or send me a message on twitter @jborniger! See you soon!
A gut-to-brain signal of fluid osmolarity controls thirst satiation
Welcome to our Monthly Journal Club! Each month I post a paper or two that I have read and find interesting. I use this as a forum for open discussion about the paper in question. Anyone can participate in the journal club, and provide comments/critiques on the paper by leaving a comment below. I picked this months paper because it reveals a circuit spanning multiple systems and timescales influencing one of our most essential behaviors, drinking and fluid intake. This month’s paper is “A gut-to-brain signal of fluid osmolarity controls thirst satiation” by Zachary Knight and colleagues at The University of California - San Francisco. The lead author was Christopher A. Zimmerman, a graduate student in Dr. Knight’s lab who focuses on homeostatic control of thirst. I will provide a brief overview of the techniques/approaches used to make it more understandable to non-expert readers. If I can’t figure something out, I’ll just say so.
How do we know when we’re thirsty, and how do we know when to stop drinking? This is very important, as we need to keep proper concentrations of ions (also known as osmolarity) within the fluid compartments of our body to stay alive. Osmolarity can be thought of as the relative concentrations of ions in a solution, where our body likes to stay around 300 milli-osmoles (mOsm), where each compartment (intra-cellular, interstitial, and blood) remain in equilibrium. If you drink too much water, you can die due to the drastic changes in osmolarity that occur, causing our cells to burst (lysis). If you are dehydrated, our cells wrinkle up (crenation), a phenomenon that can also lead to death. A jarring example of this occurred in 2007 when a radio station held a contest titled “Hold your Wee for a Wii”, where contestants were tasked with drinking as much water as they could without peeing to win a Nintendo Wii. Unfortunately, the radio DJs did not know anything about basic physiology and were under the false impression that you can drink as much water as you want without any detrimental effects. One contestant drank so much that the osmolarity of her blood became drastically different from other fluid compartments in her body leading to cell lysis, and she died as a result.
There are several well-known circuits in the brain that have been identified as key regulators of thirst and drinking behavior. These include the subfornical organ (SFO), the median preoptic nuclei (MnPO), and the supraoptic nuclei (SON). Together, these structures receive input from the mouth and throat on the amount of liquid that we are drinking in real time (that is, they detect the volume of fluid intake), and are rapidly inactivated upon drinking pretty much any type of fluid (See the Figure below). After not drinking for a while (i.e., we’re thirsty), the activity in these structures rises and promotes drinking behavior. There’s something that doesn’t quite add up here, and that is how do these structures know the ‘type’ of fluid that you’re drinking? If it is just measuring the volume, then we’d feel just as quenched after drinking a bottle of sea water as we would after drinking one of fresh water. The only real difference between fresh and sea water is the salt content (that is, sea water has a higher osmolarity than fresh water). That means that there must be an osmolarity detector somewhere in the body that relays to the brain information about the type of fluid that has been consumed. As Dr. Knight says, "There has to be a mechanism for the brain to track how salty the solutions that you drink are and use that to fine-tune thirst…But the mechanism was unknown."

Brain structures underlying thirst, drinking, and satiation. A major component is the subfornical organ (SFO), which receives input on the volume of fluid consumed, and directs changes in drinking behavior using excitatory (glutamate) and inhibitory (GABA) signaling. (Credit: Zimmerman et al., 2017)
Christopher Zimmerman and other members of the team tested this using a method called fiber photometry in tandem with intra-gastric (i.e., into the gut) injections of fluids with different osmolarity. Fiber photometry is a way to measure the activity of dozens or hundreds of cells in deep brain structures simultaneously and in real time, while an animal (in this case, a mouse) behaves and runs around normally. This makes it a great tool to see how different populations of neurons operate in real-world scenarios. Fiber photometry allowed the authors to see how neurons in the subfornical organ (SFO) respond when a thirsty mouse drinks naturally (in hydrated and dehydrated conditions), and how they respond when liquids of different osmolarity are injected directly into the gut (allowing them to bypass the volume sensors in the mouth). They confirmed prior studies that showed rapid reductions in SFO activity upon drinking either regular water or salty water. However, when they injected these liquids into the gut, the SFO reduced its activity only in conditions where normal water was injected, but not in response to salt water. This suggests that a signal from the gut makes it up to the brain, where it somehow conveys to the brain the osmolarity of a liquid that has been consumed (see the figure below)

The subfornical organ (SFO) rapidly reduces activity upon drinking either regular (Water) or salty (NaCl) water (panel b). However, when solutions of different salt concentrations (osmolarity) were directly infused into the gut (panel d), the SFO drastically increased its activity (panels e,f,g) as a function of the osmolarity of the solution (R^2 = 0.98; also known as a near 1 to 1 relationship). (note: F/F means ‘fractional fluorescent change’, indicating the activity of the cells being measured) (Credit: Zimmerman et al., 2019).
The authors moved on to investigate how the osmolarity signal is represented in other components of the thirst circuit (i.e., MnPO, SON). Targeting vasopressin neurons in the SON, they showed that these neurons act in a similar fashion to those in the SFO. They are rapidly inhibited by drinking, but also increase activity in response to elevations in blood osmolarity (see Figure below).

Supraoptic nucleus (SON) vasopressin neurons are rapidly inactivated by drinking (panel C), and bidirectionally regulated by gut fluid osmolarity (panel d). The heat maps in (d) show the activity of these neurons where warmer colors represent higher activity. Note that increases in fluid salt content (150 mM to 500 mM) causes stepwise increases in neural activity. (Credit: Zimmerman et al., 2019).
Continuing their investigation of neural circuitry controlling drinking behavior and fluid balance, they measured how the final major component in the circuit (the MnPO) alters activity in different experimental paradigms. This time, they upgraded their tech from fiber photometry to using a tiny microscope (microendoscope) implanted into the mouse’s brain to see how the individual cells in the MnPO respond to fluid intake and blood osmolarity. The picture below shows the similarities and differences of microendoscopy and fiber photometry.

Both in vivo microendoscopy (a) and fiber photometry (b) measure neural activity by collecting light emitted by a fluorescent genetically encoded calcium indicator in neurons of interest (e.g., GCaMP6s). More cumbersome and harder to use, the microendoscope technique allows researchers to examine the activity of individual cells over long periods of time in awake, behaving mice. This is a major advantage over fiber photometry, as it allows one to understand how different cells in the circuit act in response to various stimuli. (Credit: Resendez & Stuber, 2015).
Using this technique, they started by targeting neurons that make glutamate (excitatory) in the MnPO. They observed that individual neurons in this region could be clustered into three categories based on how they responded to changes in fluid intake and osmolarity. One subpopulation (cluster 1, 17%) didn’t show any response to regular saline injection but showed significant activation after salt challenge, suggesting that these neurons encode blood osmolarity. These same neurons were drastically inhibited during drinking. By contrast, neurons that fell into cluster 2 (34%) showed only quick responses independent from fluid intake (the authors think it was probably the stress or pain of injection), whereas neurons from cluster 3 (49%) were largely unresponsive.
They continued to investigate another major neural population in this region using the same technique, those that express the inhibitory neurotransmitter GABA. They also were able to segregate cells into different clusters based on their responses to fluid intake and osmolarity. Three different categories emerged. Specifically, they showed that individual neurons can be categorized as “ingestion-activated” (28%), “ingestion-inhibited” (36%), or “untuned” (35%). As the category names suggest, this means that different subsets of cells respond to fluid intake by increasing their activity, decreasing their activity, or not changing their activity at all (untuned; see panel [d] in the figure below).

GABA-producing neurons within the median preoptic nucleus (MnPO) can be clustered into “ingestion-activated”, “ingestion-inhibited”, or “untuned” based on their responses to fluid intake. in panel (d) we can clearly see segregation of these neural responses following drinking. (Credit: Zimmerman et al., 2019)
This demonstrates that individual MnPO glutamatergic neurons receive ingestion signals from the mouth/throat, satiation signals from the gut and homeostatic signals from the blood, which they process and integrate to estimate physiological state. Additionally, these data also indicate that the majority of GABAergic MnPO neurons are strongly influenced by fluid ingestion, with smaller subsets that integrate multiple signals with relevance to fluid balance (like water availability, stress and gastrointestinal osmolarity). Importantly, these studies suggest that the concept of homeostatic need (or physiological set point) can be computed at the level of individual neurons in a circuit. These findings could point the way for new therapies for diseases that drastically alter fluid balance in the body, such as diabetes and cardiovascular disease. Additional studies on regulation of homeostasis are required to understand how these populations of cells act together to receive, integrate, and relay a signal that engages drinking behavior and the feeling of ‘thirst’.
As always, let me know what you think by leaving a comment below or messaging me on twitter @jborniger ! See you guys next time! Stay curious!
Mammalian Near-Infrared Image Vision through Injectable and Self-Powered Retinal Nanoantennae
Welcome to our Monthly Journal Club! Each month I post a paper or two that I have read and find interesting. I use this as a forum for open discussion about the paper in question. Anyone can participate in the journal club, and provide comments/critiques on the paper. I picked this months paper because it is just too cool not to talk about! Published just a couple of days ago online, this month’s paper is “Mammalian Near-Infrared Image Vision through Injectable and Self-Powered Retinal Nanoantennae” by Xue Tian and colleagues at University of Science & Technology of China. I will provide a brief overview of the techniques/approaches used to make it more understandable to potential non-expert readers. If I can’t figure something out, I’ll just say so.
Have you ever wanted to see like a rattlesnake? Have you ever yearned to have ‘thermal vision’, the type you’ve undoubtedly seen on an average episode of “Cops”? Well, thanks to recent advances in science, you may soon be able to! Our vision is restricted to wavelengths of light falling between 400 and 700 nm…that’s it, everything you’ve ever seen or can ever see is due to your retina interpreting light in this range. This is great, but it is so limiting, so much so that most people never even think about what they are missing in the non-visible range of light. Indeed, things we can see fall into < 1% of the total range of the electromagnetic spectrum (see below; visible + non-visible). Imagine what we could see with 2% of the spectrum covered!
To expand the visual capabilities of mice into the near-infrared (NIR) range, the researchers developed a nanoparticle based ‘nanoantenna’ that is injectable (into the eye), self-powered, and binds normal photoreceptors (rods and cones) in the retina. These retinal photoreceptor-binding up-conversion nanoparticles (pbUCNPs) work as mini-transducers, capable of transforming NIR light into short wavelength (visible) emissions in vivo (that is, in the living animal), that the mouse can then see normally. (Image credits: Steven White, Quora.com; Newpaper24.com)


Anyone who has worked with fluorescent particles (e.g., those conjugated to secondary antibodies), knows about excitation/emission spectra. This reflects the wavelength of light that excites the fluorescent particle (in this case, nanoparticle), and then reciprocally, what type of light the particle gives off (emission). The researchers developed so-called ‘up-conversion’ nanoparticles to allow mice to see NIR light. This means that the emission spectra of these nano-antenna were of smaller (higher energy) wavelengths of light than the excitation spectra. Specifically, these nano-antenna are excited by NIR light (~980 nm wavelength), but give off light in the visible spectrum (~535 nm wavelength). Additional modifications were made to the nanoparticles to make them water-soluble (so they could be injected in phosphate buffered saline; PBS), and make them bind (uniformly) to rods and cones in the retina). Through these biochemical tricks, they were able to create nanoantennae that sense NIR light, respond to that light by emitting light in the visible spectrum, and bind to natural photoreceptors in the retina! As an added bonus, they further showed that these nano-antennae are non-toxic (at least for 2 months), as they did not cause photoreceptor degeneration or marked activation of immune cells within the retina (microglia).
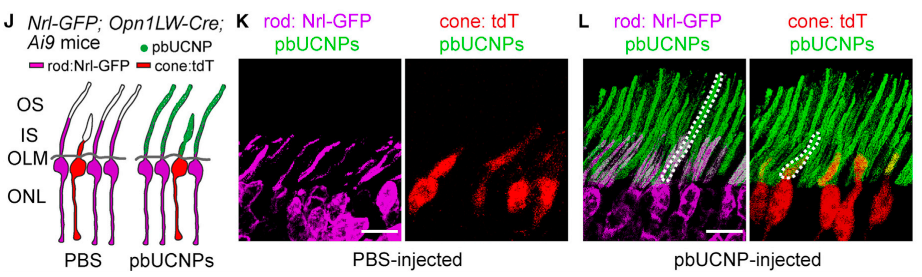
Photoreceptor-binding Up-Conversion NanoParticles (pbUNCPs) bind to natural photoreceptors (rods and cones). Above, you can see that when mice were injected with just PBS, no pbUCNP signal is observed…however when they are injected with PBS + pbUCNPs….the nanoparticles latch onto existing rods and cones, showing that they can ‘hijack’ or ‘co-opt’ normal visual pathways in the retina (Ma et al., 2019).
Ok, so how did the researchers tell if the mice could indeed see the NIR light? Their first test was a simple pupillary light reflex (PLR) test. As light intensity increases, our pupils (and those of mice) constrict to prevent damage to our retinas (think about when you got your pupils dilated…and how sensitive to light you were then). NIR light does not normally induce a PLR, because our eyes are not normally sensitive to these wavelengths of light. However, mice injected with pbUNCPs showed a dramatic PLR when exposed to NIR light, suggesting they could sense the intensity of this light!

pbUNCPs allow for detection of near-infrared (NIR) light! Above, you can see the pupils of two mice, a control mouse injected with PBS, and a mouse injected with the pbUCNPs. As you can see, when exposed to no-light, both pupils are wide, indicating that they both interpret the environment as ‘dark’. However, when exposed to NIR light (980 nm), only the mouse injected with pbUCNPs shows a pupillary light reflex (PLR), indicating that they are able to discern NIR light from darkness (an ability not possessed by control mice). (Ma et al., 2019)
To further probe the question of whether the mice could see this type of light or not, they recorded the activity of neurons in the retina of mice that had been injected with pbUNCPs or PBS (control). Indeed, only retinas from mice that had been injected with pbUNCPs showed electrical responses to NIR light, indicating that these nanoparticles were able to render the retina sensitive to this normally ‘invisible’ light. Importantly, the retina from mice injected with pbUNCPs also showed normal responses to light in the visible range (535 nm), suggesting that their ability to sense NIR light did not interfere with their ability to see ‘normal’ light.

Retinas from pbUCNP-injected, but not control-injected mice respond to NIR light! The first two panels above (vertical) show how a control mouse responds to visible light (top) and NIR light (no response; 2nd from top). Reciprocally, mice with pbUNCPs respond the same to both visible and non-visible NIR light. (Ma et al., 2019)
This physiological evidence is great, but what about something more relevant to behavior? Can mice see well enough in NIR light to make decisions in response? To test this, the authors performed a number of behavioral tests, the outcomes of which depended on whether the mouse could discriminate NIR light from visible light. The first of these tests was a widely known and well-validated test of anxiety, the “light-dark box”. This test takes advantage of the fact that mice prefer a dark over light environment (as they are nocturnal, and do not want to be spotted by a day-active predator!). Here, the researchers shined visible (535 nm) or invisible NIR light (980 nm) into the ‘light’ chamber, and tested whether control or 'pbUCNP’-injected mice responded by running into the ‘dark’ chamber. Only mice that could see the NIR light (pbUCNP-injected) responded tot he 980 nm light by running into the dark box. The mice with just normal vision could not recognize that the 980 nm light was on, and simply explored the dark and light boxes equally. Importantly, both control and pbUCNP-injected mice avoided visible light (535 nm) when it illuminated the ‘light’ chamber, suggesting that these augmented mice could see normal light just as well as the control mice.

pbUCNP-injected mice recognize and respond to NIR light cues to elicit behavioral responses. The top two panels (C,D) show results of a light-dark box test, where mice can choose to be out in the open (in the light) or retreat into a dark box (which they naturally prefer). Control mice and those injected with pbUCNPs responded to visible light (525 nm) by retreating into the dark box, however when the light was in the NIR range (980 nm), only mice injected with pbUCNPs responded, while control mice could not discern a difference between 980 nm light and darkness. In the lower panels (E,F), mice were tested for their ‘freezing’ responses in a ‘fear conditioning’ paradigm. A 535 nm (visible) light was shown for 20s before a 2 second footshock for 6 cycles to let the mice form an associative memory (where light predicts a painful stimulus (shock)). Normal mice, after forming this memory show a ‘freezing’ or ‘immobile’ response to just the light, because they ‘remember a shock is coming’. When the researchers illuminated the mice with 535 or 980 nm light after training, control mice only froze in response to the 525 nm light, while the pbUCNP injected mice froze in response to 535 and 980 nm light! (Ma et al., 2019).
To further test whether mice could really see NIR light without damage to normal vision, they used a ‘Y-shaped water maze’, where mice are put in water (which they dislike) and have to discern a triangle from a circle to escape down one arm of the ‘Y-maze’. One of the arms (e.g., the one associated with a triangle) has an elevated platform underwater that the mice naturally try to find to get out of the water. The mice are trained to know that the triangle is the right choice, and then tested at a later date to see if they remember this using shapes projected in visible (535 nm) or invisible (NIR; 980 nm) light.

Mice were tested on the ‘Y-shaped water maze’, where they had to swim to escape the water by finding a hidden platform located at the end of one of the arms of the maze. In these experiments, the triangle shape pointed the way to the hidden platform. Using various patterns of visible and NIR light, they demonstrated that only pbUCNP-injected mice could perform at levels significantly above chance (50%) when images were presented in NIR and visible light, indicating they could see not only the light, but discern discrete shapes as well. Note: Green in the above image represents shapes shown in visible light, while red indicates they were shown in NIR light (Ma et al., 2019).
They observed that no matter where they put the triangle and circle (left or right arms of the Y-maze), or what background they used (visible, dark, or NIR light), the pbUCNP injected mice almost always picked the triangle arm of the maze, allowing them to escape. In contrast, control mice could not discern the NIR light circle from the triangle, and their performance on the task was only at chance level (50% correct). This exciting study is the first to artificially enhance vision using bio-compatible nanoparticles that self-anchor to photoreceptors in the retina (rods/cones). Although mouse vision is much different than human vision (mice primarily explore their environments using smell (olfactory) cues, rather than sight), there is no biological reason why this technology couldn’t be applied to humans as well. Whether it should be….is another question! What would you do with infrared vision? How could this change the playing field for soldiers, doctors, pilots….etc…all of whom use infrared technology for very important tasks daily? Leave a comment down below and join the discussion!!
Rocking Promotes Sleep in Mice through Rhythmic Stimulation of the Vestibular System
“ Rock-a-bye baby, On the tree tops, When the wind blows, The cradle will rock. When the bough breaks, The cradle will fall, and down will come Baby, Cradle and all.” - c. 1765
Welcome to our Monthly Journal Club! Each month I post a paper or two that I have read and find interesting. I use this as a forum for open discussion about the paper in question. Anyone can participate in the journal club, and provide comments/critiques on the paper. This month’s paper is “Rocking promotes sleep in mice through rhythmic stimulation of the vestibular system” by Paul Franken and colleagues at The University of Laussane in Switzerland. I will provide a brief overview of the techniques/approaches used to make it more understandable to potential non-expert readers. If I am not familiar with something, I’ll simply say so.
There’s a whole market around baby-rocking equipment….and apparently some people will pay upwards of $1200 for one (Credit: Happiest Baby, Inc).
This month I’ll be discussing an interesting paper that tackles a topic that every parent is familiar with - rocking a baby to sleep. Why is it that gentle rocking helps us sleep…be it in a crib, car, or a loved one’s arms?
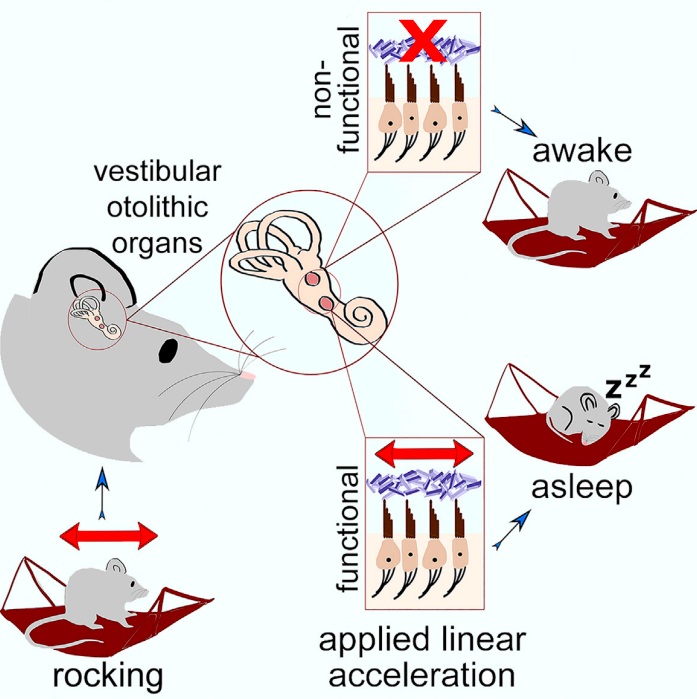
The Vestibular System Mediates Rocking-Induced Sleep
Credit: Kompotis et al., 2019
Kompotis and colleagues addressed this question using a basic science approach in mice. I was surprised a study like this hadn’t been done before, as everyone seems to just ‘know’ that gentle rocking promotes sleep, without knowing how or why. To test this question, they equipped mice with EEG/EMG electrodes to monitor brain and muscle activity (to determine sleep states), and monitored these signals for two days of no movement and one day of rocking in the horizontal plane (at 0.25, 0.5, 1.0, and 1.5 Hz) followed by a final stationary day (shown below). They chose to start with 0.25 Hz as that is a frequency that has shown to promote sleep in humans. They found that 1.0 Hz (i.e., 1 rocking motion/second) was the optimal frequency for mice, as 0.5 Hz was too little, and 1.5 Hz promoted non-rapid eye movement (NREM) sleep at the expense of REM sleep. They tried 2 Hz as well, but it was obviously discomforting to the mice so they capped out their experiments at 1.5 Hz.

1.0 Hz gentle rocking promotes NREM sleep in mice. (A) time series of sleep patterns (NREM sleep) during two baseline days without rocking (gray line), and one day of gentle rocking at different frequencies (0.25, 0.5, 1.0, and 1.5 Hz), followed by a final stationary day. Note how 1.0 and 1.5 Hz promote more NREM sleep that other frequencies. (B) comparisons of each frequency of rocking movements and how they influenced sleep. You can see that 1.5 Hz promoted the most increase in NREM sleep, but at the expense of REM sleep, therefore 1.0 Hz was deemed the ‘optimal’ frequency, as it promoted NREM sleep without disturbing REM sleep. (Credit: Kompotis et al., 2019)
To determine how rocking influenced the quality of sleep, in addition to the amount, the authors investigated the frequency components that make up the EEG (i.e., spectral analyses). In the sleep field, sleep intensity is known to correlate with increases in NREM delta power (slow waves; 0.5-4 Hz) in the EEG, so if rocking increased NREM delta power then we could speculate that it increased sleep quality in addition to amount. However, the only frequency that seemed to influence delta activity within the EEG was rocking at 1.5 Hz, where it actually caused delta power to decrease! This suggests that rocking at 1.0 Hz promotes more sleep, but this sleep is not any ‘deeper’ or ‘intense’ than normal sleep. Indeed, rocking too fast may decrease the quality of sleep.

Rocking at 1.0 Hz promotes a shift in theta frequencies from high to low during wakefulness. (Credit: Kompotis et al., 2019)
Rocking at 1.0 Hz did, however, alter the spectral (EEG frequency) components of wakefulness and REM sleep, two states that exhibit predominant theta (~6-9 Hz) rhythmic oscillations. Specifically, 1.0 Hz rocking increased low-theta and decreased high-theta frequencies during both total wakefulness and a state known as ‘active’ or ‘theta-dominated wakefulness’ (TDW; see above). A shift in the spectral components of wakefulness from higher to lower frequencies is associated with building sleep pressure and a pending transition into sleep.
To investigate a mechanism for rhythmic rocking-induced sleep, the researchers tested whether otolithic organs of the vestibular system (which monitor our head’s linear acceleration) were necessary for the effect. They tested this using mice lacking functional otoliths (nicknamed tilted mice; Otop1-tlt/tlt). When they put these mice through their rocking experiment, they showed no enhancement of sleep like their counterparts with intact otolithic organs. A final question was whether the main driver of sleep was the rhythmic (i.e., frequency) component, or the linear acceleration applied to the mouse. To test this, they equalized the linear accelerations of both the 1.0 and 1.5 Hz rocking frequencies to 178 cm/s^2. When this was done, the effect on sleep was equalized, supporting the notion that linear acceleration, rather than frequency, is the important component of rocking-induced sleep. Interestingly, vestibular afferent nerves are 3-4 times less sensitive to stimuli than those in monkeys or humans. When the authors applied this conversion to the minimal sleep-enhancing linear acceleration that affected sleep in mice (79 cm/s^2), the numbers matched those that promote sleep in humans (20-26 cm/s^2).
An interesting note that the authors make is that other sensory modalities (e.g., vision, proprioception) could further be responsible for rocking-induced sleep, as tilted mice still had these systems intact. However, this is unlikely, as there was no compensatory effect in these mice, suggesting that the majority of the effect was driven by the vestibular system (see below).
A very interesting finding from this study is that the vestibular system contributes to sleep-wake control. As the authors discuss, future studies should examine downstream pathways relaying linear acceleration signals to known sleep circuitry (e.g., the pedunculopontine tegmentum) in the brain. So…next time you try to rock your baby or pet to sleep, remember that the linear acceleration is key!

Mice lacking functional otolithic organs (tilted mice; Otop1^tlt/tlt above) do not enhance their sleep in response to rocking (Credit: Kompotis et al., 2019).
My Top 5 Coolest Studies of 2018!
Merry Christmas and Happy Holidays to everyone! I hope you all have a great new year :) I thought it would be fun to share my top 5 coolest studies of 2018 to round out the year! This is not a list of the ‘best’ studies of the year, as that is extremely hard to quantify (although all these are pretty stellar), so they are in no particular order. This is simply a list of papers that I thought tackled some interesting problems in a novel or unique way that made me think ‘damn that’s cool’. I hope you enjoy checking them out as much as I did! Click the paper titles for direct access to them.
#5 - Recovery of “lost” infant memories in mice
The phenomenon of “infantile amnesia”, where memories from early life are rapidly lost during development, has been known for quite some time. For example, almost no one has clear memories from when they were very little (e.g., 2 years old). Is this due to a problem in memory storage at this time…or are the memories stored properly, and we just can’t ‘retrieve’ them once we are adults? To investigate this question Guskjolen & colleagues used a transgenic approach to ‘optogenetically tag’ hippocampal neurons activated during the formation of an early fear memory in mice. Then, once the mice had grown up and ‘forgotten the fearful memory’, they reactivated those cells to see if they could ‘recover’ the lost memory. Indeed, they were able to do so suggesting that infantile amnesia is likely a result of retrieval failure rather than storage failure.
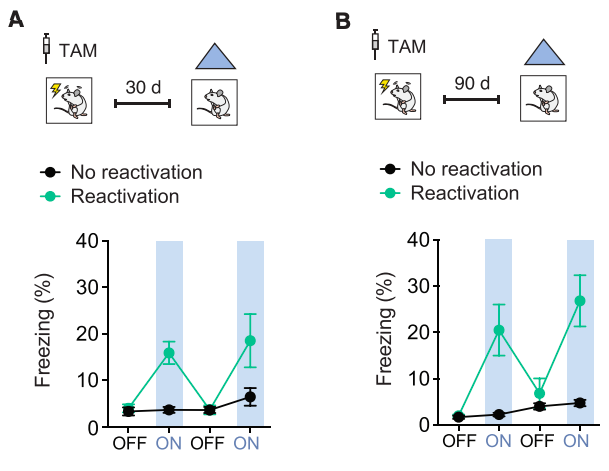
Reactivation of ‘lost’ memories in mice via optogenetic stimulation of neurons that were active during memory formation in early life. (A) Stimulation of cells activated in early life 30 days later caused mice to ‘freeze’, indicating they remembered the fearful memory; (B) this effect was long lasting, up to 90 days (longest they tested) (Credit: Guskjolen et al., 2018).
#4 - The neuronal gene arc encodes a repurposed retrotransposon gag protein that mediates intercellular rna transfer
Every once in a while there’s a paper that seems to turn biology on its head. This is an example of one of those papers, where the authors show that neurons can exchange transcriptional (RNA) information via secretion of ‘virus-like’ capsules composed of proteins thought only to be important in synaptic plasticity and memory formation. The proteins encoded by the gene arc seemed to form ‘virus-like’ structures that were able to travel between cells to exchange RNA information. This is because the gene that encodes these proteins shares an ancestry with those that made up ancient retroviruses! This type of inter-cellular communication has never been described (in mammals) and opens up a completely new regulatory and signaling pathway that may be important in neurodegenerative disease.

Intercellular transfer of messenger RNA via arc-encoded virus like proteins! (Credit: Pastuzyn et al., 2018)
#3 - Parallel circuits from the bed nuclei of stria terminalis to the lateral hypothalamus drive opposing emotional states
Ok I had to throw in this cool study out of my lab spearheaded by the great Will Giardino! Hypocretin/orexin neurons in the lateral hypothalamus modulate positive and negative aspects of arousal (e.g., promoting arousal in both rewarding, pleasurable, and stressful conditions). How a single neural population does this is unclear, but likely depends on differential inputs arriving from other brain areas. Giardino & colleagues demonstrated that different subsets of neurons in the bed nuclei of stria terminalis (BNST; extended amygdala) send projections to synapse onto hypocretin/orexin neurons, resulting in opposing responses depending on emotional state (positive or negative)!

Different populations of neurons in the BNST respond to positive (e.g., female mouse scent) or negative (e.g., predator odor) emotional stimuli . Time zero is when the stimulus was presented to the test mouse. On the Y axis you can see the fluorescent signal from CRF or CCK neurons in the BNST during stimulus presentation (credit: Giardino et al., 2018).
#2 - in toto imaging and reconstruction of post-implantation mouse development at the single cell level
Can we image every cell as a mouse develops to understand how a jumble of cells coordinates to make a complex organism like a mouse? Turns out we can! This one is just really damn cool. Check out the video below with a better explanation than I could ever give.
#1 - expanding the optogenetics toolkit with topological inversion of rhodopsins
What if we flipped the excitatory optogenetic protein channelrhodopsin upside down? Turns out it creates a pretty potent inhibitor of neural activity! I include this because it is such a simple idea, that turned out way better than I would have thought it could!…and the new opsin is called “FLInChR” which I thought was funny.

BOnus! - Medial preoptic circuit induces hunting-like actions to target objects and prey
How do animals engage appropriate behaviors necessary to survive, like stalking, hunting and chasing prey? Park & colleagues discovered that neurons in the medial preoptic area of the hypothalamus projecting to the ventral periaqueductal gray in the midbrain promote these behaviors in mice. Activation of this circuit (MPA—>vPAG) caused mice to chase, leap after, and hunt inanimate objects! Make sure to check out the figure and video link below to see this hunting behavior in action!

Activation of the MPA—>vPAG circuit promoted hunting-like behavior in mice. Here, the researchers drew (with a little ball on a stick) the letters “B” and “G”. When the laser was off, mice were scared of the object and stayed towards the edge of the arena, but when the laser was on, they hunted the object, so closely that they essentially drew the letters with their body chasing the ball!
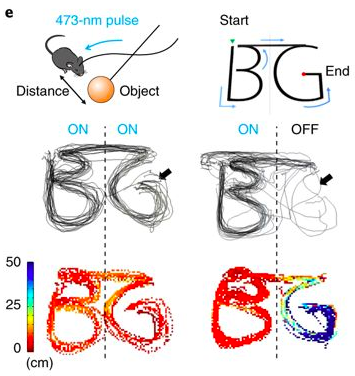
There were many more studies that I wanted to include on this list…but I thought 5 was a good number to shoot for as 10 would have been too much! Maybe I’ll do another list for the most ‘impactful’ studies of 2018…but that will have to wait for another time (as it takes time to assess impact! All the best and happy holidays!! —JCB
Defined Paraventricular Hypothalamic Populations Exhibit Differential Responses to Food Contingent on Caloric State
Welcome to our Monthly Journal Club! Each month I post a paper or two that I have read and find interesting. I use this as a forum for open discussion about the paper in question. Anyone can participate in the journal club, and provide comments/critiques on the paper. This month’s paper is “Defined Paraventricular Hypothalamic Populations Exhibit Differential Responses to Food Contingent on Caloric State” by Michael Krashes and colleagues at The National Institute of Diabetes and Digestive and Kidney Diseases (NIDDK). I will provide a brief overview of the techniques/approaches used to make it more understandable to potential non-expert readers. If I am not familiar with something, I’ll simply say so.
Uncovering the neural populations responsible for appetite, feeding, metabolic control, and hedonic (rewarding/pleasurable) responses to food is essential for crafting new therapies for obesity, anorexia, and sickness-induced (e.g., cancer) appetite suppression. The hypothalamus is a critical structure controlling food intake and appetite, however the distinct roles of specific neural sub-populations in appetite control is not clear. If we can learn the ways different genetically-defined neural populations contribute to feeding, then we can potentially design drugs or other therapies that specifically target only those cells (to have the maximum effect with little off target problems).
The paraventricular hypothalamus (‘around the ventricle’; PVH) is an especially important hypothalamic node in appetite control, illustrated by the fact that lesions of this area cause massive obesity due to large increases in food intake. It is comprised of several neuromodulator populations (all expressing the critical transcription factor SIM1) that can be genetically targeted based on their expression of specific proteins: (1) glucagon-like peptide 1 receptor [Glp1r]; (2) melanocortin-4 receptor [Mc4r], (3) oxytocin [Oxt], and (4) corticotropin-releasing hormone [Crh]. These markers are not clear-cut, and many cells express more than one. Regardless, expression of these primary proteins demonstrates that each of these populations are largely independent from one another. The roles each of these play in appetite, food intake, and metabolism are unclear. Michael Krashes’ team tackled this problem using a variety of techniques including fiber photometry, immunohistochemistry, electrophysiology, and DREADDs.

The paraventricular hypothalamus (PVH; pictured above) contains many different unique cell types. The above image shows little overlap between two primary cell types in this region, those expressing melanocortin-4 receptor (Mc4r) and oxytocin (Oxt) (2.1% overlap). (Credit: Li et al., 2018)
They started by examining the activity of these genetically defined populations throughout the entire PVH following an overnight fast or after 2 hours of re-feeding (using the immediate early gene cFos). They observed state-dependent (fasted or re-fed) changes in cFos expression, with more cFos induction in the rostral (towards the front) portions of the PVN than the medial (middle) or caudal (towards the back) regions. Looking at specific subsets of cells expressing cFos following this experiment, they demonstrate that nearly all (except Oxt) neuronal populations examined show change in activity following fasting and re-feeding (see below). Notably, Glp1r-expressing neurons more than doubled their activity following re-feeding compared to the fasting state.

Induction of cFos in genetically-defined neuronal subtypes within the PVH after fasting or fasting followed by a 2-hour re-feeding session. As you can see, nearly all subtypes showed changes in activity (except Oxt neurons) with these manipulations. Some increased activity (Glp1r and Mc4r) while Crh neurons decreased their activity upon re-feeding. (cFos in RED with cell types in GREEN). (Credit: Li et al., 2018)
The researchers then attempted to delve deeper into this discovery through electrophysiological techniques. Using a very tiny electrode to monitor the activity of single cells in real-time, they were unable to find any differences in Glp1r neuronal electrical capacitance, resistance, holding current, or resting membrane potential. However, they did note that re-feeding increased the firing rate of these neurons, supporting their immunohistochemical (cFos) data. To move from single-cell to population level analyses, the researchers used adeno-associated viral vectors to express a fluorescent calcium indicator in their neurons of choice (using the Cre/Lox system). Then, they used fiber photometry to measure the activity of these cells in freely moving mice (see below). Calcium dynamics are proxy measures of neuronal activity, as calcium concentrations rapidly change when neurons are active.
Interestingly, the researchers found that Glp1r-expressing neurons were relatively silent during fasting, or when the mice were full. However, if food was presented to the mouse when it was hungry (fasted), these cells rapidly increased their activity! This suggests that the activity of these cells is not driven just by the availability of food, but the caloric/metabolic state of the animal (i.e., these cells act as a coincidence detector)!

Fiber photometry allows for direct imaging of neural population activity in freely moving mice. In panel (A) we can see the placement of the optical fiber in the PVH to record signals coming from Glp1r-expressing neurons. Panel (B) shows that these cells do not respond to new objects placed in the environment, but do respond strongly to food when the mouse is hungry (fasted). Notably these cells don’t respond to food when the mouse is full (fed). This effect is reduced when the food is inaccessible (minutes 0-20 of panel C), but pronounced when the mice can freely access the food (minutes 20-40 of panel C). In panel (D) we can see that this effect extends to high fat diet (HFD) in addition to the mouse’s regular chow. Crh-expressing neurons showed the opposite patten (i.e., their activity was suppressed upon chow presentation after fasting; not shown) (Credit: Li et al., 2018).
They repeated this experiment with all of the four cell types they examined previously. Mc4r- and Oxt-expressing neurons showed little change in these experiments. However, Crh-expressing neurons showed nearly the opposite pattern to that of Glp1r neurons, even though they are in the same brain area! This demonstrates that Glp1r and Crh neurons reciprocally track caloric state and respond in opposite patterns upon feeding after fasting. So what happens if the researchers manipulate these cells?
To do this, they used excitatory (Gq-coupled) or inhibitory (Gi-coupled or Kappa Opioid Receptor (KORD)) DREADDs. These designer receptors do not respond to any endogenous molecule in the brain, but do respond to the inert compound clozapine-N-oxide (CNO). This allows researchers to manipulate genetically-defined (e.g., Glp1r, Mc4r, etc..) neural populations with good temporal precision via systemic injections of CNO. They focused on Glp1r neurons as these showed the strongest responses during fasting and re-feeding. Activation of these neurons strongly suppressed appetite, while inhibition of these cells promoted feeding. Pre-treatment with the anorexic drug liraglutide (Lira) prevented this increased feeding response to inhibitory DREADD signaling, suggesting that Lira “can act redundantly at multiple sites and/or its action in the PVH is not critical in modulating food intake”.
Finally, the researchers examined what happens when these different PVH populations are silenced over a long period of time (weeks and months), as all of their prior manipulations only looked at relatively short time-scales (minutes to hours). To silence these neurons, they used a virus encoding the tetanus toxin (see below), which permanently silences synapses primarily via cleavage of the protein synaptobrevin. They followed these mice for 16 weeks after viral injections, examining body weight and food intake throughout the course of the experiment (see below).
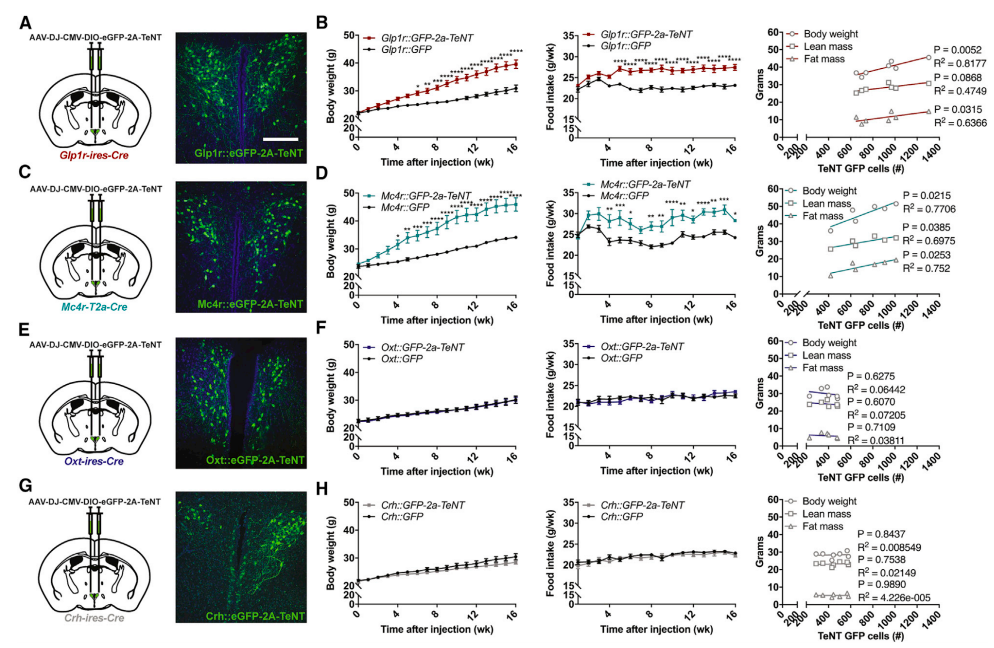
Tetanus toxin-induced chronic silencing of PVH neural subpopulations differentially affects body weight gain and food intake. In panels (A-B) we can see how silencing Glp1r neurons drastically increases body mass and food intake while panels (C-D) show a similar effect of Mc4r silencing. However, no effect was observed upon Oxt or Crh neuronal silencing. This suggests that PVH subpopulations do not serve redundant functions in weight gain and food intake. (Credit: Li et al., 2018).
Chronic silencing of Glp1r or Mc4r-expressing neurons strongly induced obesity and hyperphagia (overeating). These traits did not emerge in mice with silenced Oxt or Crh PVH neural populations. Further research needs to be done to understand how these diverse neural populations integrate and compute all that encompasses ‘appetite’ and ‘feeding’ (i.e., meal initiation, planning, satiation, and meal termination). This is a strong first step in understanding the differential responses and functions of these neurons, which will potentially lead to new treatments for metabolic diseases like obesity, anorexia, or sickness-induced appetite suppression. Future work should aim to map the afferent and efferent projections (incoming and outgoing connections) to and from these neurons, and find the critical downstream pathways controlling their anorexic or feeding effects.
Now join the discussion! Click the post title above and leave a comment!
#SFN2018 Day 4: Brain's Reward System Dictates Sleep and Wakefulness
The Ventral Tegmental Area - Reward and Arousal
During day 4, one of my favorite poster sessions took place (Sleep systems, and sleep regulators). Here, a poster that grabbed my attention was titled “GABA and glutamate networks in the VTA regulate sleep and wakefulness” from Xiao Yu, a member of William Wisden 1’s lab at Imperial College London.

Dopamine (green) and GABA (red) expressing neurons in the mouse ventral tegmental area (VTA; outlined) studies by Xiao Yu and colleagues demonstrates that these neurons bidirectionally regulate sleep and wakefulness (Credit: Jeremy C Borniger, PhD; Stanford University)
The ventral tegmental area 1 (VTA) is largely known as the seat of the brain’s ‘reward’ system. This is because neurons in this area are the primary source of all the brain’s dopamine, a ‘feel good molecule’ that is responsible for the rewarding effects of drugs, sex, and all things fun. Neurons in this area signal reward by calculating the so called ‘reward prediction error’. This is the difference between an expected and unexpected reward. For example, if you expect to get one piece of candy from your mom, but then she gives you 100 pieces of your favorite treat, neurons in the VTA calculate the difference, fire, and release a large surge of dopamine proportional to the reward ‘error’. This signal acts to reinforce the behaviors that led to the unexpected reward. A ‘good’ error like this is a called a ‘positive prediction error’ while the opposite, where a reward is omitted when it is expected, is called a ‘negative prediction error’. Negative prediction errors result in less dopamine release, and therefore aversion to the behaviors that led to this unexpected ‘disappointment’. As you may well predict, drugs of abuse like cocaine, alcohol, heroin, and others elicit a strong positive prediction error, resulting in a lot of dopamine release and reinforcement of drug seeking behavior.
In addition to dopamine neurons in the VTA, there exists two other primary populations, one that expresses the inhibitory neurotransmitter GABA, and another that produce primarily glutamate, an excitatory neurotransmitter. Recent research has demonstrated that in addition to their roles in reward signaling, VTA-dopamine neurons strongly promote wakefulness, likely through their projections to the nucleus accumbens (NAc) (see image below). How other VTA populations relate to wake/sleep states remains unknown.

Activation of VTA-dopamine neurons (TH-positive) strongly promotes wakefulness. You can see that when these neurons are stimulated (by light sensitive ChR2 activation), the mice rapidly wake up (panels c,d,e)(Credit: Eban-Rothschild et al., 2016; Nature Neuroscience)
To investigate these other populations, Xiao Yu and colleagues used optogenetics, chemogenetics, fiber photometry (Ca2+), and neuropharmacology to untangle the roles GABA and glutamate neurons in the VTA play in sleep/wake states.
First, they identified that most glutamate neurons in the VTA also express NOS1 (nitric oxide synthase 1), and therefore used NOS1 and vglut2-cre mice to specifically target these neurons for manipulation. VGLUT2 stands for ‘vesicular glutamate transporter 2’, and is expressed on virtually all subcortical neurons that signal via glutamate. Using viral vectors to specifically express the stimulatory (hM3Dq) or inhibitory (hM4Di) DREADDs, they demonstrated that stimulation of VTA-glutamate neurons strongly promotes wakefulness while inhibition of this population strongly promotes sleep. To investigate how these neurons promoted arousal, they stimulated their projections in different brain regions using optogenetics. They focused on two primary output regions, the lateral hypothalamus (which contains many sleep-related neural populations) ,and the nucleus accumbens. Stimulation of glutamate nerve terminals arriving from the VTA to the lateral hypothalamus strongly promoted wakefulness, while stimulation of similar fibers arriving at the NAc had a less pronounced effect. This suggests that VTA-glutamate neurons likely promote wakefulness via dual projections to the lateral hypothalamus and NAc. Importantly, the natural activity of these neurons (examined via fiber photometry) was shown to be highest during wakefulness and REM sleep compared to NREM sleep. This suggests that they normally change their firing rates during distinct vigilance states.

Example of a fiber photometry trace showing the activity of GABA neurons across sleep-wake states. As you can see, these neurons are mostly active during wakefulness and REM sleep compared to NREM sleep (wake = white background, NREM = blue, REM = red) (Credit: Jeremy C Borniger, PhD, Stanford University)
Similar experiments were done to examine the VTA-GABA population. Activation of these neurons (via DREADDs or optogenetics) strongly promoted sleep, while inhibition of this population powerfully promoted wakefulness. Activation of GABA nerve terminals from the VTA to the LH strongly promoted sleep, an opposite effect to that of glutamate stimulation in LH. This effect was partially inhibited when stimulations occurred in combination with a drug (gabazine) that inhibits GABA signaling. This suggests that it is GABA (and not other molecules) released by these neurons that is largely responsible for their effects of sleep/wake states. Finally, they hypothesized that this effect could be driven by GABA’s inhibitory influence over VTA-dopamine populations. By inhibiting VTA-GABA neurons in combination with dopamine blockade, they were able to (mostly) eliminate the effect of VTA-GABA silencing on wakefulness. This supports a model in which VTA-GABA neurons inhibit neighboring VTA-dopamine neurons in order to promote sleep.
This is an exciting research area as a major problems for drug abuse victims are insomnia and chronic fatigue, which inevitably lead to the reinstatement of drug seeking behavior. Sleep drugs targeting the VTA could really help rectify general sleep problems and specifically those related to drug abuse.
Feel free to follow me on twitter here for more!
#SFN2018 Day 3: Chili Peppers, Inflammatory Pain...and I Won an Award! :)
During the day 3 AM poster session, I managed to snag Sampurna Chakrabarti (Follow her on Twitter), a winner of the SFN Trainee Professional Development Award, to talk about her recent research on mechanisms of inflammatory pain.
To study this, she and her colleagues injected Complete Freund’s Adjuvant (CFA) into one of the knees of a mouse, leaving the other knee as a ‘control’. ‘Adjuvants’ like CFA elicit a strong inflammatory response, and can boost adaptive (primarily lymphocytes like T cells and B cells) immunity. An easy way to remember which cells are which is that T-cells mature in the Thymus gland, while B cells mature in the Bone marrow. Injections of CFA into joints is a widely used model with which to elicit an inflammatory response and study diseases like arthritis.

The dorsal root ganglia (there’s two at almost all vertebrae) relay sensory information arriving from everywhere in the body. They serve a key role in reflex responses (e.g., to a hot grill) that occur before the brain becomes “aware” that something happened, and they also act as a highway to transmit information to the spinal cord and up to the brain (Credit: Quora.com)
Causing this inflammatory reaction in the joint causes mice (and people) to experience pain, severely impairing one’s quality of life and in some cases, mobility. The open question is, “how does this inflammatory reaction cause this pain response?” and “can we prevent this to provide relief for patients with joint pain?”
To measure pain responses in mice, they used a quick behavioral assay that determines how much a mouse digs down into the bedding in it’s cage. Mice naturally dig to form nests and burrows, while mice in pain can’t muster up enough energy to complete this task. As a secondary measure, Sampurna and her colleagues also measured the swelling of the knee as an index of inflammation. Their hypothesis was that inflammation sensitizes sensory neurons (located in the dorsal root ganglia ; DRG) relaying information from the knee to the spinal cord, leading to joint pain.
But how could inflammation ‘sensitize’ a neuron to joint pain? The family of proteins called TRPV (‘trip-Vee’) receptors is widely known to be important in the recognition of painful stimuli. TRPV1, specifically, is most famous for its alternative name, the ‘capsaicin receptor’. Capsaicin is the molecule in chili peppers that causes the painful burning sensation, making it a useful ingredient in things that cause pain, like pepper spray.

Neurons projecting to the inflamed knee (‘knee neurons’ labeled with FB) from the dorsal root ganglion expressed a much higher amount of the capsaicin receptor (TRPV1), without changes in the receptor for Nerve Growth Factor (a molecule associated with increased neural sensitivity; TrkA) (Credit: Chakrabarti et al., 2018; Neuropharmacology)
The researchers assessed whether dorsal root ganglion neurons projecting to the knee were hypersensitive by recording from- and stimulating them using electrophysiology. To identify only neurons that project to the knee of interest, they injected a retrograde label into the joint (called Fast Blue ; FB) to label upstream neurons projecting to the knee. Because neurons labeled with FB ‘glow’ under a microscope, it is easy to see and manipulate only the neurons of interest (so called ‘knee-neurons’).
They observed that following CFA administration, these neurons had a lower threshold for firing action potentials in response to a number of stimuli, including the chili pepper compound, capsaicin. This indicated that they were more sensitive to noxious stimuli, which could explain the sensation of pain elicited by the inflamed joint. But what is causing this ‘sensitization’? They used immunohistochemistry to show that knee-neurons express much higher levels of the capsaicin receptor and the combination of the capsaicin receptor and TrkA (the receptor for nerve growth factor; NGF). This supported the idea that inflammation up-regulates NGF and TRPV1 signaling to sensitize neurons, resulting in pain.

Blocking TRPV1 signaling using a receptor antagonist prevents inflammatory joint pain elicited by injections of CFA. In panels B and C you can see that without the antagonist, the mice fail to show their normal happy digging behaviors. However, with the antagonist, their behavior returns to normal, indicating that they are no longer in pain (Credit: Chakrabarti et al., 2018; Neuropharmacology)
As a final test to see if TRPV1 is really the culprit, they repeated their digging behavior assay after CFA administration with or without the TRPV1 receptor blocker (antagonist) “A-425619”. When the actions of TRPV1 were blocked, mice with inflamed knees no longer showed signs of pain, suggesting that manipulating this pathway may be a good strategy to reduce joint pain. .
Indeed, the researchers are now moving their findings in mice onto humans to see if this effect can be repeated to improve quality of life in patients with arthritis and other joint diseases!
WC Young Recent Graduate Award
Another highlight of day 3 was being awarded the WC Young Recent Graduate Award from the Society for Behavioral Neuroendocrinology (SBN)!
William C. Young was one of the founders of modern behavioral neuroendocrinology. The SBN honors WC Young through the "WC Young Recent Graduate Award" (initially created in the 1960's by one of the society's predecessors, the West Coast Sex Conference). Selection criteria for the WC Young Recent Graduate Award are based on the doctoral dissertation, scholarly productivity, and letters of reference.
I was awarded for my work on brain-tumor interactions (mediated by the satiety hormones leptin and ghrelin). You can see my paper detailing this work here.

Me (left) and SBN President Rae Silver, a legend in the field for her work on circadian rhythms, awarding me the WC Young Recent Graduate Award at the SBN Social event in the Marriott Marquis next to the San Diego Convention Center.
I am honored to receive the WC Young Recent Graduate award from the Society for Behavioral Neuroendocrinology! WC Young was one of the first to recognize that many hormones play different roles depending on developmental stage. In early life, they act to ‘organize’ a system (e.g., reproductive), and later in life they ‘engage’ or ‘activate’ this system and the behaviors necessary for survival (e.g., mating, fighting, feeding…). In this way, hormones help build the hardware AND run the software!
He also recognized the myopic view of testing only animals of a single species, of a single sex, or of a single age…as problematic. This has only gotten more relevant as years have passed. We need to reinvigorate comparative neuroscience, and bring it along into the 21st century.
See a short piece I wrote about reinvigorating comparative neuroscience here.
That’s all for day 3! Tomorrow (the 6th) is jam packed with interesting stuff. So I’ll try to go HAM.
#SFN18 Day 2 Recap: Controlling Neurons with Ultrasound and a Novel Avenue for Depression Treatment?
Sonogenetics - A non-invasive method to manipulate neurons
During the AM poster sessions, one that caught my eye was from the Chalasani Lab at the Salk Institute in La Jolla, California. Several years ago, they described a method by which they could control neural activity in the nematode worm C. elegans using focused ultrasound. This paper demonstrated that ectopic expression of the mechanosensitive channel TRP-4 in neurons rendered them sensitive to ultrasound stimulation. This is a big deal because other so called ‘non-invasive’ neural manipulation techniques like optogenetics require a fiber optic probe to be placed near the cells of interest, making the manipulation of deep brain structures with high temporal precision tedious.

Sonogenetics allows for non-invasive control of neural activity. Here, in C. elegans with PVD neurons expressing the ultrasound-sensitive protein (TRP-4) and the calcium indicator GCaMP3, we can see that ultrasound exposure drastically increases calcium activity in these neurons, indicating ultrasound mediated neural activation. Warmer colors indicate more GCaMP3 fluorescence = more activity (Credit: Ibsen et al., 2015; Nature Communications)
This was to be just the first step in a long process of isolating different mechanosensitive proteins and screening them in mammalian cells to find one just right for use in more complicated organisms. During the poster session this morning, Corinne Lee-Kubli, a post-doc in the Chalasani lab, provided an update on the progress in sonogenetics to date.
Using an in vitro screening method to identify ultrasound-sensitive mechanoreceptors, Corinne expressed a large variety of putative channels in cells in a dish. These cells were co-transfected with the calcium indicator GCaMP6f, a powerful and fast reporter of cell activity. The fluorescent signal was then monitored before, during, and after ultrasound stimulation in a high-throughput manner.
A subset of the putative mechanoreceptors were packaged into cre-dependent AAV-viral vectors and delivered to AgRP neurons deep in the brain (arcuate nucleus) of AgRP-cre mice. Validation of the excitatory actions of the ultrasound sensitive protein was done using a feeding assay, as AgRP neurons strongly promote feeding. Upon ultrasound (10 MHz) stimulation of the head (through the skull and entire brain), a few of the channels strongly promoted feeding responses, a trait not observed in mice expressing the control virus (encoding GFP). An important note is that ultrasound stimulation alone had no effect on feeding responses, indicating a specific effect of the putative mechanoreceptor in AgRP neurons.

AgRP neurons in the arcuate nucleus expressing the calcium indicator GCaMP6. These cells are powerful regulators of feeding behavior and metabolism (Credit: Srisai et al., 2017; Nature Communications)
This proof-of-principle application represents a significant advancement for the nascent field of sonogenetics. Much more research needs to be done to discover the most potent and specific ultrasound sensitive protein, the kinetics of said protein, and additional tools for cell inhibition. In the future, we can expect to see multiple channels expressed in different cellular populations, each sensitive to different ultrasound frequencies. Then, ‘nested’ delivery of different ultrasound waveforms could putatively activate and/or inhibit discrete cell populations across the entire brain, simultaneously or with tight temporal control.
The power of this technique is impressive, as ultrasound can easily reach through the entire mouse brain at 10 MHz, and can go much deeper (e.g., in rat or primate brain) using lower frequencies. I look forward to what’s to come!
Bidirectional Control of Depression Through Hypothalamic Feeding Circuits
Speaking of the arcuate nucleus, during the day 2 poster sessions, one that caught my eye was titled “Chronic unpredictable stress modulates neuronal activity of AgRP and POMC neurons in hypothalamic arcuate nucleus” presented by Xing Fang in the Xin-yun Lu lab at the Medical College of Georgia at Augusta University.
Agouti-related peptide (AgRP) and pro-opiomelanocortin (POMC) neurons in the arcuate nucleus strongly regulate feeding behavior and food intake. Broadly, AgRP neurons promote feeding (orexigenic), while POMC neurons work in a reciprocal manner to suppress feeding (anorexigenic).

AgRP neurons in the arcuate promote food intake while POMC neurons inhibit food intake via their actions on downstream MC4R- expressing neurons in the paraventricular nucleus (Credit: Carol A. Rouzer, Vanderbilt University)
Depression is characterized by aberrant responses to environmental stimuli. For example, chronic psychological stress can promote depression in humans and animal models. Stress-induced depression is characterized by anhedonia (not enjoying what you used to love), lethargy and despair, and changes in feeding behavior and appetite. How does stress cause these behaviors to come about?
Using in vivo electrophysiology, behavioral assays, and DREADDs, Fang and colleagues investigated the role of hypothalamic AgRP and POMC neurons (two populations that powerfully control appetite) in mediating these behaviors.
This work builds on previous studies by the group, long linking depressive-like behavior to alterations in feeding and satiety hormones such as leptin.
To induce depression in mice, the researchers used a technique called ‘chronic unpredictable stress’ (CUS). This model strongly promotes a depression-like state after 10 days of unpredictable stress where mice go through a gamut of constant light exposure, tail pinches, restraint, and shock stimuli, among others.

Viral injections into the arcuate nucleus of POMC-Cre mice (left panels; projections in red) shows their wide axonal distribution throughout the brain. Similarly, injections into the arcuate nucleus of AgRP-cre mice demonstrate that they also project throughout the brain, although in a different pattern (right panels, projections in green) (Credit: Wang et al., 2015; Frontiers in Neuroanatomy)
Through their electrophysiological recordings, the researchers demonstrated that CUS decreased the firing rate of AgRP neurons but increased the firing rate of POMC neurons. When they tested the role of AgRP neurons in depressive-like behavior using stimulatory (Gq) or inhibitory (Gi) DREADDs, they were able to elicit opposite responses. Stimulation of these neurons improved depressive-like behavior, while inhibition promoted it.
Together, these studies suggest that AgRP and POMC neurons play an important role in stress-related adaptive behavior. Importantly, they provide a novel circuit related to depression which may be targetable for the treatment of the disease through pharmacological agents or lifestyle changes.
That’s all from me for day two, where I tried to focus more on posters than talks! Unfortunately I could only highlight 2 out of >5,000 interesting ones!
Follow me on twitter for live updates and stay tuned for more!
#SFN18 Day 1 Recap: Circadian Surprises and Blowing Up Brains!
Day and night, breakfast and dinner, winter and summer, wake and sleep…our lives are dominated by interacting rhythms in our environment and our behavior. Why is it that we sleep at night and not during the day? Why are heart attacks and strokes more common in the morning than the evening? How do animals adapt to winter and summer? Why do we get jet-lag, and what is it, exactly? All these questions revolve around a central subject in neuroscience: circadian clocks. During day 1 of the Society for Neuroscience annual meeting in San Diego, CA, I was treated to a nanosymposium (timely insights in circadian regulation) highlighting new and exciting research in this area. Chaired by Steven Brown and Alessandra Porcu, this session covered all aspects of circadian biology, from behavior to neuronal circuits, and from synapses to molecules.

The suprachiasmatic nuclei (pictured above) serve as the master clocks controlling mammalian circadian rhythms (Credit: Jeremy C. Borniger, PhD; Stanford)
Here, I highlight a few of the talks that I found the most interesting. Unfortunately, I am not able to cover everything, and some really cool stuff slipped through! That’s the downside of this immense conference…there’s never enough time to see everything!
Two talks on the same protein (one in flies and the other in mammals) grabbed my attention. These talks were given by Masashi Tabuchi and Benjamin Bell, two researchers from Johns Hopkins University. During Masashi’s talk, he described a potential mechanism by which the protein Wide Awake (WAKE) regulates sleep/wake cycles in flies.

WAKE regulates sleep quality through appropriate timing of neural firing codes (Credit: Tabuchi et al., 2018; Cell)
He showed that irregular neural firing rates during the day (regulated by WAKE) promote arousal while regular firing patterns during the night promote sleep.
Ben Bell followed up his talk by taking their findings in flies to mammals, describing a mammalian ortholog to the fly WAKE protein (called mWAKE). mWAKE is highly enriched in the master clock, the suprachiasmatic nucleus (SCN) suggesting it plays a role in circadian time keeping or regulation.
Unlike in flies, knockout of mWAKE in mice only caused mild problems in sleep/wake states. However, through measuring locomotor activity, the researchers found that these mice were extremely hyperactive (>5 times more active than wild-type mice). Curiously, this trait (phenotype) only came about during the dark phase (mice are nocturnal, so active during the dark phase). To investigate this further, the researchers examined the firing rates of SCN neurons during the day and night. Normal mice have a large difference between the night and day in SCN firing rates, with peak neural activity occurring during the day. However, mWAKE knockout mice showed no difference between day and night, with firing rates remaining high all the time!
Additionally, cells lacking mWAKE showed blunted responses to the inhibitory neurotransmitter GABA, and this lack of inhibition may explain the hyperactive profile mice lacking mWAKE had. Finally, they examined (using an mWAKE reporter mouse) where mWAKE expressing cells project to throughout the brain. They found that cell bodies were distributed throughout the brain, in all major arousal centers. Importantly, they seemed to be discrete from other neuromodulator systems present in these areas, like hypocretin/orexin neurons in the lateral hypothalamus, or histamine neurons in the tuberomammillary nucleus.
Significant more research is required to fully understand the role this protein plays in sleep/wake states. Is it a ‘master regulator’ of arousal? Does it interact with every ‘arousal center’ differently or does it have a distributed ‘homogenous’ effect across the brain. When does mWAKE start to express during development? Does this coincide with changes to sleep-wake behavior during early age? I’m excited to follow this story going forward!
Expansion Microscopy - ‘Just add Water’
Microscopes are getting beefier and beefier, more complex and expensive, with the sole purpose of being able to see tiny, tiny things just a little bit better. Enter ‘expansion microscopy’, an idea that literally works in the opposite direction to that goal. Instead of ‘zooming in closer’, expansion microscopy aims to ‘blow things up’ in order to see the (once) tiny details (like synapses, or nuclear pores…) on a conventional microscope. Remember those dinosaurs that would expand when you added water as a kid? I sure do…and expansion microscopy works pretty much the same.
Although this technology has been around for a few years, it is just getting started in terms of its ease of use, applicability to different samples (proteins, RNA, DNA, lipids…), and support community. All info on this fascinating technique is available at ExpansionMicroscopy.org.
First described by Edward Boyden and colleagues at the MIT Media Lab in 2015, expansion microscopy is rapidly being applied across fields, species, and disciplines to examine extremely fine structures at the nanoscale (10-20 nm).

Expansion microscopy allows for uniform expansion of a biological sample. Here, we see a brain slice (in panel B) which has been weaved into a polymer mesh with biomolecular anchors. When the polymer is expanded (‘Just add water’), it pulls the biomolecules along with it, maintaining the relative spacing between structures. In (C ) we can see that same brain slice ‘expanded’, revealing tiny pieces of biology previously too small to see(Credit: Chen et al., 2015; Science).
Ed Boyden provided a ‘state of the art’ summary of expansion microscopy to date at a minisymposium today titled “new observations in neuroscience using superresolution microscopy” chaired by Michihiro Igarashi. He gave a quick overview on how they developed the idea that was to become expansion microscopy, through adapting old techniques from the early 1980’s. Next, he discussed the problems of ‘expansion’, the primary one being ’ how can we evenly expand a sample without losing valuable spacial relationships between proteins, DNA, RNA etc…? To overcome this problem they needed to develop biomolecular anchors, which link the molecular target to the polymer mesh. In this way, isometric expansion of the mesh results in the same for the anchored sample.
Using this technique, many researchers have expanded tissues to look at things like synaptic proteins and microtubules at a much finer detail than what was previously possible with conventional confocal microscopes. Others have adapted the technique to work with in situ hybridization, allowing for expansion and quantification of RNA. Dr. Boyden’s lab is also working on expanding non-soft tissues, like bone, and using expansion microscopy in the clinic to diagnose and investigate cancer in unprecedented detail (so called ‘expansion pathology’).
By combining expansion microscopy with RNA visualization (ExFISH) and sequencing (MERFISH), hundreds of transcripts can be examined simultaneously in situ!
Towards the end of the talk, Dr. Boyden highlighted some open questions in the field. These questions focused on a few primary themes:
Can we validate expanded samples below 10-20 nm?
Is expansion ‘pulling’ synapses apart, leading us to false conclusions?
Can we use this technique to probe protein-protein interactions?
Whats the smallest thing we can expand? Can we expand a virus? A DNA origami??
How much can we expand a sample while maintaining all relevant spatial relationships?
To take the last question, Dr. Boyden’s team reasoned, if we can expand something once, why not twice, or thrice?? They put samples through an iterative process allowing for expansion up to 20x the original size!! (shown below)

Iterative Expansion Microscopy allows for sample expansion up to 20x! Panel A shows dendritic spines without expansion, panel B shows the same at 4.5x expansion, and panel C shows dendritic spines at 20x expansion after the iterative process is complete (Credit: Chang et al., 2017; Nature Methods)
A cool side effect of expansion is that it involves filling the sample with water, making it essentially transparent, and useful for long-range circuit mapping at high detail or speeding up techniques like light-sheet microscopy. We are only at the surface of what is possible with this and other super-resolution techniques. I look forward to all the exciting things to come!
That’s my two cents for day 1. Keep an eye out for more coverage of some of the coolest stuff at SFN 2018!
My Coverage of #SfN2018 (Nov. 3-7th)
Hey all! This coming month we will be taking a break from regular journal club to cover the happenings at the biggest scientific meeting in the world: The Society for Neuroscience (SfN) annual meeting in San Diego, CA.

If you’ve been to the News section of this website, you’ve noticed that I have been selected to be an ‘official blogger’ for the meeting, so many of the posts here will be simultaneously posted on NeurOnline.
My primary areas of focus are Theme I: Techniques, and Theme F: Integrative Physiology & Behavior

Me in what is possibly the wrinkliest shirt in existence at #SFN 2015.
In this introductory post, I wanted to share my itinerary so you know what talks/posters I find interesting and which I plan on visiting. If you’re a meeting attendee, please feel to reach out and talk to me about your research or about other things at the meeting that you think are interesting.
Please keep an eye on these blog posts for in depth coverage of the meeting. For ‘real-time’ updates, follow me on twitter.
Check out my itinerary for the meeting HERE. This itinerary is (of course) subject to change so don’t take it as dogma.